Chrysler 2009 Annual Report Download - page 180
Download and view the complete annual report
Please find page 180 of the 2009 Chrysler annual report below. You can navigate through the pages in the report by either clicking on the pages listed below, or by using the keyword search tool below to find specific information within the annual report.-
 1
1 -
2
-
3
-
4
-
5
-
6
-
7
-
8
-
9
-
10
-
11
-
12
-
13
-
14
-
15
-
16
-
17
-
18
-
19
-
20
-
21
-
22
-
23
-
24
-
25
-
26
-
27
-
28
-
29
-
30
-
31
-
32
-
33
-
34
-
35
-
36
-
37
-
38
-
39
-
40
-
41
-
42
-
43
-
44
-
45
-
46
-
47
-
48
-
49
-
50
-
51
-
52
-
53
-
54
-
55
-
56
-
57
-
58
-
59
-
60
-
61
-
62
-
63
-
64
-
65
-
66
-
67
-
68
-
69
-
70
-
71
-
72
-
73
-
74
-
75
-
76
-
77
-
78
-
79
-
80
-
81
-
82
-
83
-
84
-
85
-
86
-
87
-
88
-
89
-
90
-
91
-
92
-
93
-
94
-
95
-
96
-
97
-
98
-
99
-
100
-
101
-
102
-
103
-
104
-
105
-
106
-
107
-
108
-
109
-
110
-
111
-
112
-
113
-
114
-
115
-
116
-
117
-
118
-
119
-
120
-
121
-
122
-
123
-
124
-
125
-
126
-
127
-
128
-
129
-
130
-
131
-
132
-
133
-
134
-
135
-
136
-
137
-
138
-
139
-
140
-
141
-
142
-
143
-
144
-
145
-
146
-
147
-
148
-
149
-
150
-
151
-
152
-
153
-
154
-
155
-
156
-
157
-
158
-
159
-
160
-
161
-
162
-
163
-
164
-
165
-
166
-
167
-
168
-
169
-
 170
170 -
 171
171 -
 172
172 -
 173
173 -
 174
174 -
 175
175 -
 176
176 -
 177
177 -
 178
178 -
 179
179 -
 180
180 -
 181
181 -
 182
182 -
 183
183 -
 184
184 -
 185
185 -
 186
186 -
 187
187 -
 188
188 -
 189
189 -
 190
190 -
191
-
192
-
193
-
194
-
195
-
196
-
197
-
198
-
199
-
200
-
201
-
202
-
203
-
204
-
205
-
206
-
207
-
208
-
209
-
210
-
211
-
212
-
213
-
214
-
215
-
216
-
217
-
218
-
219
-
220
-
221
-
222
-
223
-
224
-
225
-
226
-
227
-
228
-
229
-
230
-
231
-
232
-
233
-
234
-
235
-
236
-
237
-
238
-
239
-
240
-
241
-
242
-
243
-
244
-
245
-
246
-
247
-
248
-
249
-
250
-
251
-
252
-
253
-
254
-
255
-
256
-
257
-
258
-
259
-
260
-
261
-
262
-
263
-
264
-
265
-
266
-
267
-
268
-
269
-
270
-
271
-
272
-
273
-
274
-
275
-
276
-
277
-
278
-
279
-
280
-
281
-
282
-
283
-
284
-
285
-
286
-
287
-
288
-
289
-
290
-
291
-
292
-
293
-
294
-
295
-
296
-
297
-
298
-
299
-
300
-
301
-
302
-
303
-
304
-
305
-
306
-
307
-
308
-
309
-
310
-
311
-
312
-
313
-
314
-
315
-
316
-
317
-
318
-
319
-
320
-
321
-
322
-
323
-
324
-
325
-
326
-
327
-
328
-
329
-
330
-
331
-
332
-
333
-
334
-
335
-
336
-
337
-
338
-
339
-
340
-
341
-
342
-
343
-
344
-
345
-
346
-
347
-
348
-
349
-
350
-
351
-
352
-
353
-
354
-
355
-
356
-
357
-
358
-
359
-
360
-
361
-
362
-
363
-
364
-
365
-
366
-
367
-
368
-
369
-
370
-
371
-
372
-
373
-
374
 |
 |

179
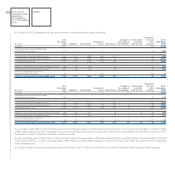
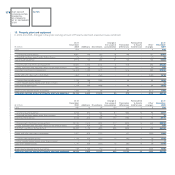
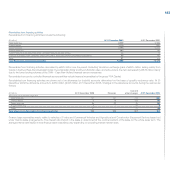
Revaluations and Write-downs consist of adjustments to the carrying value of investments accounted for using the equity method for the Group’s share of
the profit or loss for the year of the investee company for an amount of€18 million in 2009 (€133 million in 2008). In 2009 and in 2008 this item also includes
impairment losses recognised during the period for investments accounted for under the cost method.
In 2009 the increase of€2 million shown in the column Change in the scope of consolidation includes the effect of accounting for certain minor subsidiaries,
which were previously consolidated on a line-by-line basis, using the equity method. The decrease of€20 million in 2008 shown in the column Change in
the scope of consolidation includes the consolidation of certain minor subsidiaries.
In 2009 Acquisitions and capitalisations amounted to€63 million (€72 million in 2008), of which€48 million (€43 million in 2008) related to the capital
increase made by the 50/50 jointly controlled entity Fiat India Automobiles Private Limited. The item also refers to the capitalisations of other, more minor,
companies.
Disposals and other changes, a reduction of€68 million in 2009 consists of a decrease of€53 million as the result of the distribution of dividends by
companies accounted for using the equity method; the positive fair value adjustment of€3 million relating to investment classified as available-for-sale and
other minor decreases of€18 million.
In 2008 Disposals and other changes, a reduction of€200 million consisted of a decrease of€37 million arising from the disposal of the investment in
Consolidated Diesel Company (in the third quarter of 2008) and a decrease of€8 million arising from the disposal of certain minor investments; a decrease
of€84 million as the result of the distribution of dividends by companies accounted for using the equity method; the negative fair value adjustment of
€15 million relating to investments classified as available-for-sale; and other decreases of€56 million (including negative changes in the cash flow hedge
reserves of Tofas-Turk Otomobil Fabrikasi Tofas A.S. for€28 million and FGA Capital S.p.A. for€16 million).
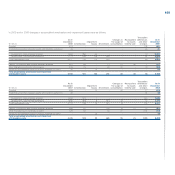
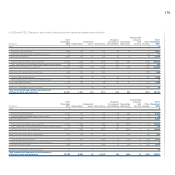
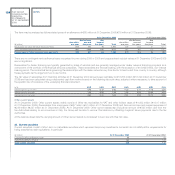
The item Investments in jointly controlled entities comprises the following:
At 31 December 2009 At 31 December 2008
% of interest (€ million) % of interest (€ million)
FGA Capital S.p.A. 50.0 643 50.0 617
Tofas-Turk Otomobil Fabrikasi Tofas A.S. 37.9 241 37.9 190
Naveco (Nanjing Iveco Motor Co.) Ltd. 50.0 137 50.0 128
Société Européenne de Véhicules Légers du Nord-Sevelnord Société Anonyme 50.0 105 50.0 98
Società Europea Veicoli Leggeri-Sevel S.p.A. 50.0 95 50.0 98
Turk Traktor Ve Ziraat Makineleri A.S. 37.5 49 37.5 48
SAIC Iveco Commercial Vehicle Investment Company Limited 50.0 43 50.0 55
New Holland HFT Japan Inc. 50.0 23 50.0 26
Fiat India Automobiles Private Limited 50.0 21 50.0 31
LBX Company LLC 50.0 16 50.0 26
CNH de Mexico SA de CV 50.0 16 50.0 17
Transolver Finance Establecimiento Financiero de Credito S.A. 50.0 8 50.0 15
Other 34 28
Total Investments in jointly controlled entities 1,431 1,377
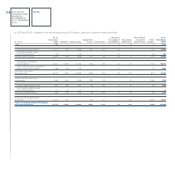
The item Investments in associates comprises the following:
At 31 December 2009 At 31 December 2008
% of interest (€ million) % of interest (€ million)
Iveco Finance Holdings Limited 49.0 127 49.0 147
Rizzoli Corriere della Sera MediaGroup S.p.A. 10.1 108 10.1 117
Kobelco Construction Machinery Co. Ltd. 20.0 88 20.0 123
CNH Capital Europe S.a.S. 49.9 63 49.9 66
Al-Ghazi Tractors Ltd. 43.2 17 43.2 17
Other 38 42
Total Investments in associates 441 512