Chrysler 2009 Annual Report Download - page 71
Download and view the complete annual report
Please find page 71 of the 2009 Chrysler annual report below. You can navigate through the pages in the report by either clicking on the pages listed below, or by using the keyword search tool below to find specific information within the annual report.-
 1
1 -
2
-
3
-
4
-
5
-
6
-
7
-
8
-
9
-
10
-
11
-
12
-
13
-
14
-
15
-
16
-
17
-
18
-
19
-
20
-
21
-
22
-
23
-
24
-
25
-
26
-
27
-
28
-
29
-
30
-
31
-
32
-
33
-
34
-
35
-
36
-
37
-
38
-
39
-
40
-
41
-
42
-
43
-
44
-
45
-
46
-
47
-
48
-
49
-
50
-
51
-
52
-
53
-
54
-
55
-
56
-
57
-
58
-
59
-
60
-
 61
61 -
 62
62 -
 63
63 -
 64
64 -
 65
65 -
 66
66 -
 67
67 -
 68
68 -
 69
69 -
 70
70 -
 71
71 -
 72
72 -
 73
73 -
 74
74 -
 75
75 -
 76
76 -
 77
77 -
 78
78 -
 79
79 -
 80
80 -
 81
81 -
82
-
83
-
84
-
85
-
86
-
87
-
88
-
89
-
90
-
91
-
92
-
93
-
94
-
95
-
96
-
97
-
98
-
99
-
100
-
101
-
102
-
103
-
104
-
105
-
106
-
107
-
108
-
109
-
110
-
111
-
112
-
113
-
114
-
115
-
116
-
117
-
118
-
119
-
120
-
121
-
122
-
123
-
124
-
125
-
126
-
127
-
128
-
129
-
130
-
131
-
132
-
133
-
134
-
135
-
136
-
137
-
138
-
139
-
140
-
141
-
142
-
143
-
144
-
145
-
146
-
147
-
148
-
149
-
150
-
151
-
152
-
153
-
154
-
155
-
156
-
157
-
158
-
159
-
160
-
161
-
162
-
163
-
164
-
165
-
166
-
167
-
168
-
169
-
170
-
171
-
172
-
173
-
174
-
175
-
176
-
177
-
178
-
179
-
180
-
181
-
182
-
183
-
184
-
185
-
186
-
187
-
188
-
189
-
190
-
191
-
192
-
193
-
194
-
195
-
196
-
197
-
198
-
199
-
200
-
201
-
202
-
203
-
204
-
205
-
206
-
207
-
208
-
209
-
210
-
211
-
212
-
213
-
214
-
215
-
216
-
217
-
218
-
219
-
220
-
221
-
222
-
223
-
224
-
225
-
226
-
227
-
228
-
229
-
230
-
231
-
232
-
233
-
234
-
235
-
236
-
237
-
238
-
239
-
240
-
241
-
242
-
243
-
244
-
245
-
246
-
247
-
248
-
249
-
250
-
251
-
252
-
253
-
254
-
255
-
256
-
257
-
258
-
259
-
260
-
261
-
262
-
263
-
264
-
265
-
266
-
267
-
268
-
269
-
270
-
271
-
272
-
273
-
274
-
275
-
276
-
277
-
278
-
279
-
280
-
281
-
282
-
283
-
284
-
285
-
286
-
287
-
288
-
289
-
290
-
291
-
292
-
293
-
294
-
295
-
296
-
297
-
298
-
299
-
300
-
301
-
302
-
303
-
304
-
305
-
306
-
307
-
308
-
309
-
310
-
311
-
312
-
313
-
314
-
315
-
316
-
317
-
318
-
319
-
320
-
321
-
322
-
323
-
324
-
325
-
326
-
327
-
328
-
329
-
330
-
331
-
332
-
333
-
334
-
335
-
336
-
337
-
338
-
339
-
340
-
341
-
342
-
343
-
344
-
345
-
346
-
347
-
348
-
349
-
350
-
351
-
352
-
353
-
354
-
355
-
356
-
357
-
358
-
359
-
360
-
361
-
362
-
363
-
364
-
365
-
366
-
367
-
368
-
369
-
370
-
371
-
372
-
373
-
374
 |
 |

REPORT ON
OPERATIONS
FINANCIAL
REVIEW -
FIAT GROUP
70
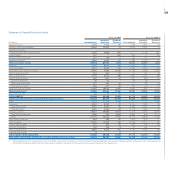
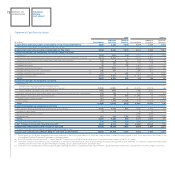
Net Debt by Activity
At 31.12.2009 At 31.12.2008
Industrial Financial Industrial Financial
(€ million)
Consolidated Activities Services Consolidated Activities Services
Financial payables (28,527) (20,898) (13,812) (21,379) (14,522) (13,590)
Asset-backed financing (7,086) (464) (6,655) (6,663) (669) (6,014)
Other (21,441) (20,434) (7,157) (14,716) (13,853) (7,576)
Current financial receivables from
jointly-controlled financial services entities (a) 14 14 - 3 3 -
Intersegment financial receivables - 5,286 893 - 6,162 570
Intersegment financial receivables
included under Assets held for sale - - 4 - - 1
Financial payables, net of intersegment balances and current financial
receivables from jointly-controlled financial services entities (28,513) (15,598) (12,915) (21,376) (8,357) (13,019)
Other financial assets (b) 636 617 23 764 748 19
Other financial liabilities (b) (464) (420) (48) (1,202) (1,078) (127)
Liquidity 12,443 10,983 1,460 3,860 2,738 1,122
Current securities 217 164 53 177 134 43
Cash and cash equivalents 12,226 10,819 1,407 3,683 2,604 1,079
Net (debt)/cash (15,898) (4,418) (11,480) (17,954) (5,949) (12,005)
(a) Includes current financial amounts receivable from FGA Capital by other companies in the Fiat Group.
(b) Includes assets and liabilities arising from the fair value recognition of derivative financial instruments.
Financial payables for Industrial Activities consist partially of funding raised by the central treasury to support the activities of the financial services companies
(shown under intersegment financial receivables).
Intersegment financial receivables for Financial Services companies, however, represent loans or advances to industrial companies – in relation to
receivables sold to financial services companies which do not meet the derecognition requirements of IAS 39 – as well as liquidity temporarily deposited
with the central treasury.
At year end, Cash and cash equivalents included Cash with a pre-determined use of €530 million (€473 million at year end 2008), primarily for the Financial
Services companies and allocated to servicing securitisation vehicles (included under asset-backed financing).
Net debt for the Financial Services companies at 31 December 2009 reflected a decrease of €525 million over 31 December 2008. Cash from operating
activities (€245 million) and a decrease in the lending portfolio (€843 million) were partly offset by dividends paid to industrial companies (€139 million) and
currency translation differences (€487 million).