Chrysler 2009 Annual Report Download - page 88
Download and view the complete annual report
Please find page 88 of the 2009 Chrysler annual report below. You can navigate through the pages in the report by either clicking on the pages listed below, or by using the keyword search tool below to find specific information within the annual report.-
 1
1 -
2
-
3
-
4
-
5
-
6
-
7
-
8
-
9
-
10
-
11
-
12
-
13
-
14
-
15
-
16
-
17
-
18
-
19
-
20
-
21
-
22
-
23
-
24
-
25
-
26
-
27
-
28
-
29
-
30
-
31
-
32
-
33
-
34
-
35
-
36
-
37
-
38
-
39
-
40
-
41
-
42
-
43
-
44
-
45
-
46
-
47
-
48
-
49
-
50
-
51
-
52
-
53
-
54
-
55
-
56
-
57
-
58
-
59
-
60
-
61
-
62
-
63
-
64
-
65
-
66
-
67
-
68
-
69
-
70
-
71
-
72
-
73
-
74
-
75
-
76
-
77
-
 78
78 -
 79
79 -
 80
80 -
 81
81 -
 82
82 -
 83
83 -
 84
84 -
 85
85 -
 86
86 -
 87
87 -
 88
88 -
 89
89 -
 90
90 -
 91
91 -
 92
92 -
 93
93 -
 94
94 -
 95
95 -
 96
96 -
 97
97 -
 98
98 -
99
-
100
-
101
-
102
-
103
-
104
-
105
-
106
-
107
-
108
-
109
-
110
-
111
-
112
-
113
-
114
-
115
-
116
-
117
-
118
-
119
-
120
-
121
-
122
-
123
-
124
-
125
-
126
-
127
-
128
-
129
-
130
-
131
-
132
-
133
-
134
-
135
-
136
-
137
-
138
-
139
-
140
-
141
-
142
-
143
-
144
-
145
-
146
-
147
-
148
-
149
-
150
-
151
-
152
-
153
-
154
-
155
-
156
-
157
-
158
-
159
-
160
-
161
-
162
-
163
-
164
-
165
-
166
-
167
-
168
-
169
-
170
-
171
-
172
-
173
-
174
-
175
-
176
-
177
-
178
-
179
-
180
-
181
-
182
-
183
-
184
-
185
-
186
-
187
-
188
-
189
-
190
-
191
-
192
-
193
-
194
-
195
-
196
-
197
-
198
-
199
-
200
-
201
-
202
-
203
-
204
-
205
-
206
-
207
-
208
-
209
-
210
-
211
-
212
-
213
-
214
-
215
-
216
-
217
-
218
-
219
-
220
-
221
-
222
-
223
-
224
-
225
-
226
-
227
-
228
-
229
-
230
-
231
-
232
-
233
-
234
-
235
-
236
-
237
-
238
-
239
-
240
-
241
-
242
-
243
-
244
-
245
-
246
-
247
-
248
-
249
-
250
-
251
-
252
-
253
-
254
-
255
-
256
-
257
-
258
-
259
-
260
-
261
-
262
-
263
-
264
-
265
-
266
-
267
-
268
-
269
-
270
-
271
-
272
-
273
-
274
-
275
-
276
-
277
-
278
-
279
-
280
-
281
-
282
-
283
-
284
-
285
-
286
-
287
-
288
-
289
-
290
-
291
-
292
-
293
-
294
-
295
-
296
-
297
-
298
-
299
-
300
-
301
-
302
-
303
-
304
-
305
-
306
-
307
-
308
-
309
-
310
-
311
-
312
-
313
-
314
-
315
-
316
-
317
-
318
-
319
-
320
-
321
-
322
-
323
-
324
-
325
-
326
-
327
-
328
-
329
-
330
-
331
-
332
-
333
-
334
-
335
-
336
-
337
-
338
-
339
-
340
-
341
-
342
-
343
-
344
-
345
-
346
-
347
-
348
-
349
-
350
-
351
-
352
-
353
-
354
-
355
-
356
-
357
-
358
-
359
-
360
-
361
-
362
-
363
-
364
-
365
-
366
-
367
-
368
-
369
-
370
-
371
-
372
-
373
-
374
 |
 |
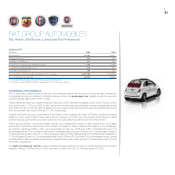
87
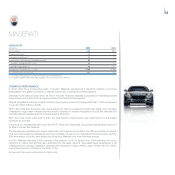
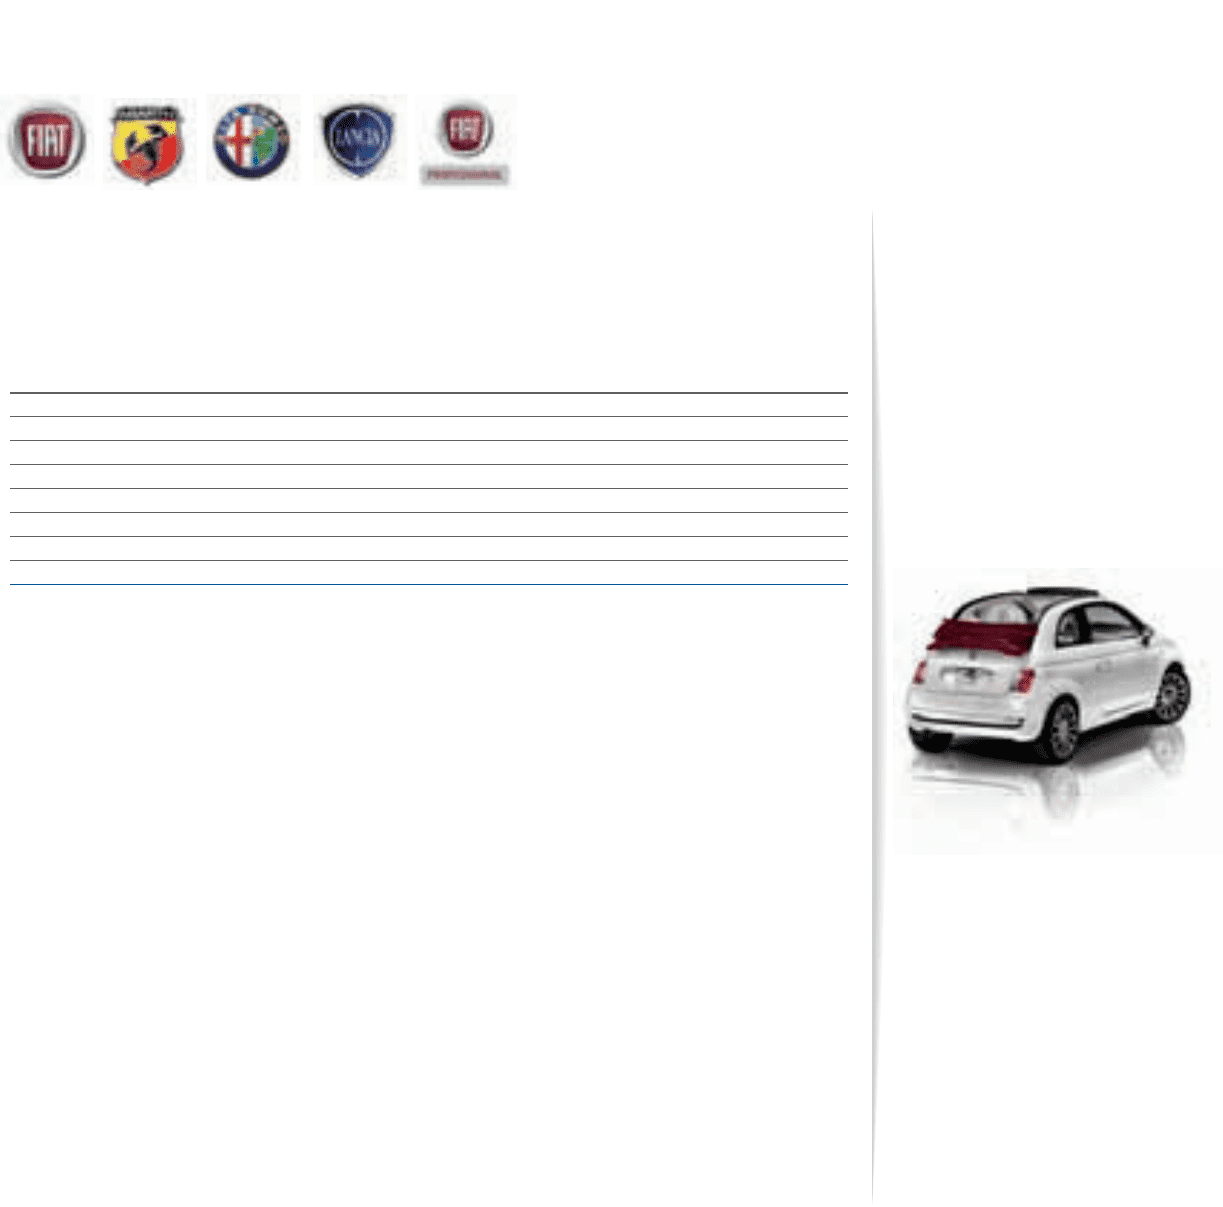
FIAT GROUP AUTOMOBILES
Fiat, Abarth, Alfa Romeo, Lancia and Fiat Professional
HIGHLIGHTS
(E million) 2009 2008
Net revenues 26,293 26,937
Trading profit/(loss) 470 691
Operating profit/(loss) (*) 217 460
Investments in tangible and intangible assets 1,495 2,288
of which capitalised R&D costs 446 641
Total R&D expenditure (**) 669 843
Cars and light commercial vehicles delivered (no. of units) 2,150,700 2,152,500
No. of employees at year end 54,038 52,634
(*) Including restructuring costs and other unusual income/(expense).
(**) Includes capitalised R&D and R&D charged directly to the income statement.
COMMERCIAL PERFORMANCE
After a particularly negative start to the year, the scrapping incentives introduced in several major markets led
to a gradual recovery in demand in Western Europe, where the passenger car market closed the year with
volumes slightly higher than 2008 (+0.5%).
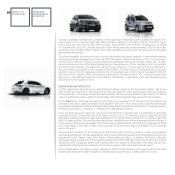
These incentives had a very positive impact in Germany, where demand increased 23.2%, and in France, where
the market grew 10.7% over 2008. In Italy, government incentives helped maintain demand substantially in line
with 2008 (-0.2%). In both the UK and Spain, however, where incentives were introduced towards the end of the
first half, demand was down 6.4% and 17.9%, respectively.
Outside of Western Europe, performance in the Sector’s key markets was mixed. In Poland, demand remained
stable (+0.1%), while in Brazil there was a further increase (+12.6%) over the positive performance in 2008
underpinned by government purchase incentives and a generally favourable economic environment.
FGA’s strong offering of environmentally-friendly cars enabled the Sector to fully benefit from eco-based
government incentives. Fiat Group Automobiles continued to make positive share gains in the passenger
car market, reaching 32.8% in Italy (+0.9 percentage points over 2008) and 8.8% in Western Europe (+0.6
percentage points). FGA’s relative performance was particularly strong in Germany (+1.5 percentage points to
4.7%) and positive also in the UK (+0.6 percentage points to 3.5%). Market share for the Fiat brand increased to
7.1% in Western Europe (+0.5 percentage points over 2008) and 25.5% in Italy (+0.4 percentage points). Lancia
and Alfa Romeo also increased market share in Western European, each gaining 0.1 percentage points to 0.9%
and 0.8%, respectively.
The light commercial vehicle market in Western Europe declined 27.4% over 2008. Demand fell in all major
markets: France (-18.8%), Italy (-21.4%), Germany (-24.8%), the UK (-35.5%) and Spain (-35.6%).