Chrysler 2009 Annual Report Download - page 73
Download and view the complete annual report
Please find page 73 of the 2009 Chrysler annual report below. You can navigate through the pages in the report by either clicking on the pages listed below, or by using the keyword search tool below to find specific information within the annual report.-
 1
1 -
2
-
3
-
4
-
5
-
6
-
7
-
8
-
9
-
10
-
11
-
12
-
13
-
14
-
15
-
16
-
17
-
18
-
19
-
20
-
21
-
22
-
23
-
24
-
25
-
26
-
27
-
28
-
29
-
30
-
31
-
32
-
33
-
34
-
35
-
36
-
37
-
38
-
39
-
40
-
41
-
42
-
43
-
44
-
45
-
46
-
47
-
48
-
49
-
50
-
51
-
52
-
53
-
54
-
55
-
56
-
57
-
58
-
59
-
60
-
61
-
62
-
 63
63 -
 64
64 -
 65
65 -
 66
66 -
 67
67 -
 68
68 -
 69
69 -
 70
70 -
 71
71 -
 72
72 -
 73
73 -
 74
74 -
 75
75 -
 76
76 -
 77
77 -
 78
78 -
 79
79 -
 80
80 -
 81
81 -
 82
82 -
 83
83 -
84
-
85
-
86
-
87
-
88
-
89
-
90
-
91
-
92
-
93
-
94
-
95
-
96
-
97
-
98
-
99
-
100
-
101
-
102
-
103
-
104
-
105
-
106
-
107
-
108
-
109
-
110
-
111
-
112
-
113
-
114
-
115
-
116
-
117
-
118
-
119
-
120
-
121
-
122
-
123
-
124
-
125
-
126
-
127
-
128
-
129
-
130
-
131
-
132
-
133
-
134
-
135
-
136
-
137
-
138
-
139
-
140
-
141
-
142
-
143
-
144
-
145
-
146
-
147
-
148
-
149
-
150
-
151
-
152
-
153
-
154
-
155
-
156
-
157
-
158
-
159
-
160
-
161
-
162
-
163
-
164
-
165
-
166
-
167
-
168
-
169
-
170
-
171
-
172
-
173
-
174
-
175
-
176
-
177
-
178
-
179
-
180
-
181
-
182
-
183
-
184
-
185
-
186
-
187
-
188
-
189
-
190
-
191
-
192
-
193
-
194
-
195
-
196
-
197
-
198
-
199
-
200
-
201
-
202
-
203
-
204
-
205
-
206
-
207
-
208
-
209
-
210
-
211
-
212
-
213
-
214
-
215
-
216
-
217
-
218
-
219
-
220
-
221
-
222
-
223
-
224
-
225
-
226
-
227
-
228
-
229
-
230
-
231
-
232
-
233
-
234
-
235
-
236
-
237
-
238
-
239
-
240
-
241
-
242
-
243
-
244
-
245
-
246
-
247
-
248
-
249
-
250
-
251
-
252
-
253
-
254
-
255
-
256
-
257
-
258
-
259
-
260
-
261
-
262
-
263
-
264
-
265
-
266
-
267
-
268
-
269
-
270
-
271
-
272
-
273
-
274
-
275
-
276
-
277
-
278
-
279
-
280
-
281
-
282
-
283
-
284
-
285
-
286
-
287
-
288
-
289
-
290
-
291
-
292
-
293
-
294
-
295
-
296
-
297
-
298
-
299
-
300
-
301
-
302
-
303
-
304
-
305
-
306
-
307
-
308
-
309
-
310
-
311
-
312
-
313
-
314
-
315
-
316
-
317
-
318
-
319
-
320
-
321
-
322
-
323
-
324
-
325
-
326
-
327
-
328
-
329
-
330
-
331
-
332
-
333
-
334
-
335
-
336
-
337
-
338
-
339
-
340
-
341
-
342
-
343
-
344
-
345
-
346
-
347
-
348
-
349
-
350
-
351
-
352
-
353
-
354
-
355
-
356
-
357
-
358
-
359
-
360
-
361
-
362
-
363
-
364
-
365
-
366
-
367
-
368
-
369
-
370
-
371
-
372
-
373
-
374
 |
 |

REPORT ON
OPERATIONS
FINANCIAL
REVIEW -
FIAT GROUP
72
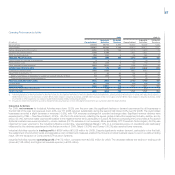
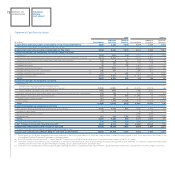
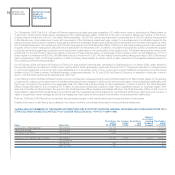
Statement of Cash Flows by Activity
2009 2008 (*)
Industrial Financial Industrial Financial
(€ million)
Consolidated
Activities Services
Consolidated
Activities Services
A) CASH AND CASH EQUIVALENTS AT BEGINNING OF THE YEAR (AS REPORTED) 3,683 2,604 1,079 6,639 5,546 1,093
Cash and cash equivalents included under Assets held for sale - - - 2 2 -
B) CASH AND CASH EQUIVALENTS AT BEGINNING OF THE YEAR 3,683 2,604 1,079 6,641 5,548 1,093
C) CASH FROM/(USED IN) OPERATING ACTIVITIES DURING THE YEAR:
Profit/(loss) (848) (848) 158 1,721 1,721 304
Amortisation and depreciation (net of vehicles sold under buy-back commitments or leased) 2,673 2,667 6 2,811 2,802 9
(Gains)/losses on disposal of non-current assets and other non-cash items (a) 343 8 177 203 (119) 18
Dividends received 53 183 15 84 115 9
Change in provisions 96 171 (75) (161) (149) (12)
Change in deferred income taxes (179) (188) 9 (490) (532) 42
Changes relating to buy-back commitments (b) (58) (59) 1 (88) (81) (7)
Changes relating to operating leases (c) (41) 3 (44) (147) (3) (144)
Change in working capital 2,562 2,564 (2) (3,767) (3,604) (163)
TOTAL 4,601 4,501 245 166 150 56
D) CASH FROM/(USED IN) INVESTING ACTIVITIES:
Investments in:
Property, plant and equipment and intangible assets
(net of vehicles sold with buy-back commitments or leased) (3,386) (3,382) (4) (4,979) (4,973) (6)
Unconsolidated subsidiaries and other investments (105) (105) - (148) (152) -
Proceeds from the sale of non-current assets (net of vehicles sold under buy-back commitments) 108 105 3 234 203 31
Net change in receivables from financing activities 882 39 843 (1,493) 10 (1,503)
Change in other current securities (27) (30) 3 118 24 94
Other changes (31) 1,395 (1,426) 176 (1,194) 1,370
TOTAL (2,559) (1,978) (581) (6,092) (6,082) (14)
E) CASH FROM/(USED IN) FINANCING ACTIVITIES:
Net change in financial payables and other financial assets/liabilities 6,295 5,602 693 3,896 3,840 56
Increase in share capital 13 13 - 15 14 5
(Purchase)/disposal of own shares - - - (238) (238) -
Dividends paid (27) (33) (139) (546) (546) (40)
TOTAL 6,281 5,582 554 3,127 3,070 21
Currency translation differences 220 110 110 (159) (82) (77)
F) NET CHANGE IN CASH AND CASH EQUIVALENTS 8,543 8,215 328 (2,958) (2,944) (14)
G) CASH AND CASH EQUIVALENTS AT END OF THE YEAR 12,226 10,819 1,407 3,683 2,604 1,079
of which: Cash and cash equivalents included under Assets held for sale - - - - - -
H) CASH AND CASH EQUIVALENTS AT END OF THE YEAR (AS REPORTED) 12,226 10,819 1,407 3,683 2,604 1,079
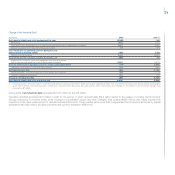
(*) Some figures for 2008 differ marginally from those published in the 2008 Annual Report, as they have been restated to reflect the improvement to IAS 16, as described in the Notes to the
Consolidated Financial Statements and notes to preceding tables.
(a) For 2009, includes the reversal of a €117 million gain (€271 million loss for 2008) in the fair value of two stock-option related swaps on Fiat S.p.A. shares.
(b) Cash from vehicles sold under buy-back commitments for the periods reported above, net of amounts already recognised through the income statement, is included in a separate line item under
operating activities which also includes the change in working capital, capital expenditures and depreciation.
(c) Cash flows from operating leases are recognised under operating activities in a separate line item which includes capital expenditure, depreciation, impairment losses and changes in inventory.