Chrysler 2009 Annual Report Download - page 171
Download and view the complete annual report
Please find page 171 of the 2009 Chrysler annual report below. You can navigate through the pages in the report by either clicking on the pages listed below, or by using the keyword search tool below to find specific information within the annual report.-
 1
1 -
2
-
3
-
4
-
5
-
6
-
7
-
8
-
9
-
10
-
11
-
12
-
13
-
14
-
15
-
16
-
17
-
18
-
19
-
20
-
21
-
22
-
23
-
24
-
25
-
26
-
27
-
28
-
29
-
30
-
31
-
32
-
33
-
34
-
35
-
36
-
37
-
38
-
39
-
40
-
41
-
42
-
43
-
44
-
45
-
46
-
47
-
48
-
49
-
50
-
51
-
52
-
53
-
54
-
55
-
56
-
57
-
58
-
59
-
60
-
61
-
62
-
63
-
64
-
65
-
66
-
67
-
68
-
69
-
70
-
71
-
72
-
73
-
74
-
75
-
76
-
77
-
78
-
79
-
80
-
81
-
82
-
83
-
84
-
85
-
86
-
87
-
88
-
89
-
90
-
91
-
92
-
93
-
94
-
95
-
96
-
97
-
98
-
99
-
100
-
101
-
102
-
103
-
104
-
105
-
106
-
107
-
108
-
109
-
110
-
111
-
112
-
113
-
114
-
115
-
116
-
117
-
118
-
119
-
120
-
121
-
122
-
123
-
124
-
125
-
126
-
127
-
128
-
129
-
130
-
131
-
132
-
133
-
134
-
135
-
136
-
137
-
138
-
139
-
140
-
141
-
142
-
143
-
144
-
145
-
146
-
147
-
148
-
149
-
150
-
151
-
152
-
153
-
154
-
155
-
156
-
157
-
158
-
159
-
160
-
 161
161 -
 162
162 -
 163
163 -
 164
164 -
 165
165 -
 166
166 -
 167
167 -
 168
168 -
 169
169 -
 170
170 -
 171
171 -
 172
172 -
 173
173 -
 174
174 -
 175
175 -
 176
176 -
 177
177 -
 178
178 -
 179
179 -
 180
180 -
 181
181 -
182
-
183
-
184
-
185
-
186
-
187
-
188
-
189
-
190
-
191
-
192
-
193
-
194
-
195
-
196
-
197
-
198
-
199
-
200
-
201
-
202
-
203
-
204
-
205
-
206
-
207
-
208
-
209
-
210
-
211
-
212
-
213
-
214
-
215
-
216
-
217
-
218
-
219
-
220
-
221
-
222
-
223
-
224
-
225
-
226
-
227
-
228
-
229
-
230
-
231
-
232
-
233
-
234
-
235
-
236
-
237
-
238
-
239
-
240
-
241
-
242
-
243
-
244
-
245
-
246
-
247
-
248
-
249
-
250
-
251
-
252
-
253
-
254
-
255
-
256
-
257
-
258
-
259
-
260
-
261
-
262
-
263
-
264
-
265
-
266
-
267
-
268
-
269
-
270
-
271
-
272
-
273
-
274
-
275
-
276
-
277
-
278
-
279
-
280
-
281
-
282
-
283
-
284
-
285
-
286
-
287
-
288
-
289
-
290
-
291
-
292
-
293
-
294
-
295
-
296
-
297
-
298
-
299
-
300
-
301
-
302
-
303
-
304
-
305
-
306
-
307
-
308
-
309
-
310
-
311
-
312
-
313
-
314
-
315
-
316
-
317
-
318
-
319
-
320
-
321
-
322
-
323
-
324
-
325
-
326
-
327
-
328
-
329
-
330
-
331
-
332
-
333
-
334
-
335
-
336
-
337
-
338
-
339
-
340
-
341
-
342
-
343
-
344
-
345
-
346
-
347
-
348
-
349
-
350
-
351
-
352
-
353
-
354
-
355
-
356
-
357
-
358
-
359
-
360
-
361
-
362
-
363
-
364
-
365
-
366
-
367
-
368
-
369
-
370
-
371
-
372
-
373
-
374
 |
 |
170 FIAT GROUP
CONSOLIDATED
FINANCIAL
STATEMENTS
AT 31 DECEMBER
2009
NOTES
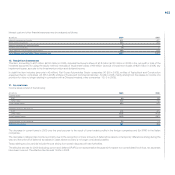
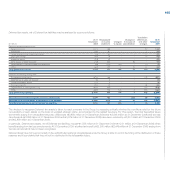
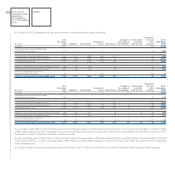
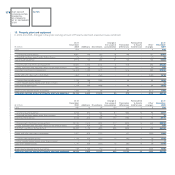
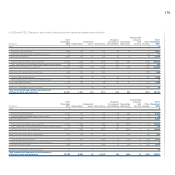
In 2009 and in 2008 changes in the net carrying amount of Intangible assets were as follows:
Translation
At 31 Change in Reclassified diff. and At 31
December Impairment the scope of to Assets other December
(€ million) 2008 Additions Amortisation losses Divestitures consolidation held for sale changes 2009
Goodwill 2,815 - - - - - - (39) 2,776
Trademarks and other intangible assets
with indefinite useful lives 170 - - - - - - (5) 165
Development costs externally acquired 1,344 307 (286) (50) (22) - - 49 1,342
Development costs internally generated 1,985 739 (419) (64) (8) - - 18 2,251
Total Development costs 3,329 1,046 (705) (114) (30) - - 67 3,593
Patents, concessions and licenses externally acquired 389 68 (126) - (4) - - 32 359
Other intangible assets externally acquired 307 69 (73) - (5) - - (3) 295
Advances and intangible assets in
progress externally acquired 38 7 - (10) - - - (24) 11
Total net carrying amount of Intangible assets 7,048 1,190 (904) (124) (39) - - 28 7,199
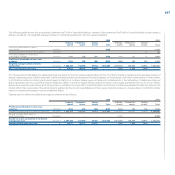
Translation
At 31 Change in Reclassified diff. and At 31
December Impairment the scope of to Assets other December
(€ million) 2007 Additions Amortisation losses Divestitures consolidation held for sale changes 2008
Goodwill 2,724 - - (12) - 31 - 72 2,815
Trademarks and other intangible assets
with indefinite useful lives 162 - - - - - - 8 170
Development costs externally acquired 1,428 475 (372) (1) (43) - - (143) 1,344
Development costs internally generated 1,534 741 (363) (9) (19) 6 - 95 1,985
Total Development costs 2,962 1,216 (735) (10) (62) 6 - (48) 3,329
Patents, concessions and licenses externally acquired 392 108 (131) - (3) 1 (7) 29 389
Other intangible assets externally acquired 229 147 (66) - (1) 2 - (4) 307
Advances and intangible assets in
progress externally acquired 54 20 - (10) (1) 2 - (27) 38
Total net carrying amount of Intangible assets 6,523 1,491 (932) (32) (67) 42 (7) 30 7,048
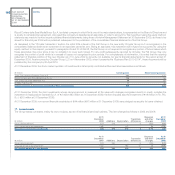
The increase of€42 million in the net carrying amount of Intangible assets in 2008 arising from the Change in the scope of consolidation consisted mainly
of€41 million deriving from the consolidation on a line-by-line basis of the Ergom Group and€1 million from the acquisition of Tritec Motors Ltda (now FPT
Powertrain do Brasil – Industria e Comércio de Motores Ltda).
Foreign exchange gains of€27 million in 2009 principally reflect the appreciation of the Real against the Euro, partially offset by the depreciation of the US
Dollar against the Euro. In 2008, exchange gains of€6 million principally reflect changes in the Euro/US dollar, Euro/Real, Euro/Zloty and Euro/Canadian
dollar exchange rate.
In 2008 a reversal of previously recognised impairment losses for€17 million was included in the column Translation differences and Other changes.