Chrysler 2009 Annual Report Download - page 131
Download and view the complete annual report
Please find page 131 of the 2009 Chrysler annual report below. You can navigate through the pages in the report by either clicking on the pages listed below, or by using the keyword search tool below to find specific information within the annual report.-
 1
1 -
2
-
3
-
4
-
5
-
6
-
7
-
8
-
9
-
10
-
11
-
12
-
13
-
14
-
15
-
16
-
17
-
18
-
19
-
20
-
21
-
22
-
23
-
24
-
25
-
26
-
27
-
28
-
29
-
30
-
31
-
32
-
33
-
34
-
35
-
36
-
37
-
38
-
39
-
40
-
41
-
42
-
43
-
44
-
45
-
46
-
47
-
48
-
49
-
50
-
51
-
52
-
53
-
54
-
55
-
56
-
57
-
58
-
59
-
60
-
61
-
62
-
63
-
64
-
65
-
66
-
67
-
68
-
69
-
70
-
71
-
72
-
73
-
74
-
75
-
76
-
77
-
78
-
79
-
80
-
81
-
82
-
83
-
84
-
85
-
86
-
87
-
88
-
89
-
90
-
91
-
92
-
93
-
94
-
95
-
96
-
97
-
98
-
99
-
100
-
101
-
102
-
103
-
104
-
105
-
106
-
107
-
108
-
109
-
110
-
111
-
112
-
113
-
114
-
115
-
116
-
117
-
118
-
119
-
120
-
 121
121 -
 122
122 -
 123
123 -
 124
124 -
 125
125 -
 126
126 -
 127
127 -
 128
128 -
 129
129 -
 130
130 -
 131
131 -
 132
132 -
 133
133 -
 134
134 -
 135
135 -
 136
136 -
 137
137 -
 138
138 -
 139
139 -
 140
140 -
 141
141 -
142
-
143
-
144
-
145
-
146
-
147
-
148
-
149
-
150
-
151
-
152
-
153
-
154
-
155
-
156
-
157
-
158
-
159
-
160
-
161
-
162
-
163
-
164
-
165
-
166
-
167
-
168
-
169
-
170
-
171
-
172
-
173
-
174
-
175
-
176
-
177
-
178
-
179
-
180
-
181
-
182
-
183
-
184
-
185
-
186
-
187
-
188
-
189
-
190
-
191
-
192
-
193
-
194
-
195
-
196
-
197
-
198
-
199
-
200
-
201
-
202
-
203
-
204
-
205
-
206
-
207
-
208
-
209
-
210
-
211
-
212
-
213
-
214
-
215
-
216
-
217
-
218
-
219
-
220
-
221
-
222
-
223
-
224
-
225
-
226
-
227
-
228
-
229
-
230
-
231
-
232
-
233
-
234
-
235
-
236
-
237
-
238
-
239
-
240
-
241
-
242
-
243
-
244
-
245
-
246
-
247
-
248
-
249
-
250
-
251
-
252
-
253
-
254
-
255
-
256
-
257
-
258
-
259
-
260
-
261
-
262
-
263
-
264
-
265
-
266
-
267
-
268
-
269
-
270
-
271
-
272
-
273
-
274
-
275
-
276
-
277
-
278
-
279
-
280
-
281
-
282
-
283
-
284
-
285
-
286
-
287
-
288
-
289
-
290
-
291
-
292
-
293
-
294
-
295
-
296
-
297
-
298
-
299
-
300
-
301
-
302
-
303
-
304
-
305
-
306
-
307
-
308
-
309
-
310
-
311
-
312
-
313
-
314
-
315
-
316
-
317
-
318
-
319
-
320
-
321
-
322
-
323
-
324
-
325
-
326
-
327
-
328
-
329
-
330
-
331
-
332
-
333
-
334
-
335
-
336
-
337
-
338
-
339
-
340
-
341
-
342
-
343
-
344
-
345
-
346
-
347
-
348
-
349
-
350
-
351
-
352
-
353
-
354
-
355
-
356
-
357
-
358
-
359
-
360
-
361
-
362
-
363
-
364
-
365
-
366
-
367
-
368
-
369
-
370
-
371
-
372
-
373
-
374
 |
 |
130 FIAT GROUP
CONSOLIDATED
FINANCIAL
STATEMENTS
AT 31 DECEMBER
2009
STATEMENT OF
CASH FLOWS
PURSUANT
TO CONSOB
RESOLUTION
NO. 15519
OF 27 JULY 2006
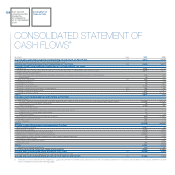
CONSOLIDATED STATEMENT
OF CASH FLOWS
pursuant to Consob Resolution No. 15519 of 27 July 2006
2009 2008
of which of which
(€ million) Note Total Related parties Total Related parties
A) CASH AND CASH EQUIVALENTS AT BEGINNING OF THE YEAR AS REPORTED (22) 3,683 6,639
Cash and cash equivalents included as Assets held for sale - - 2 -
B) CASH AND CASH EQUIVALENTS AT BEGINNING OF THE YEAR (22) 3,683 6,641
C) CASH FLOWS FROM (USED IN) OPERATING ACTIVITIES DURING THE YEAR:
Profit/(loss (848) - 1,721 -
Amortisation and depreciation (net of vehicles sold under buy-back commitments and leased assets) 2,673 - 2,811 -
(Gains) losses on disposal of:
Property, plant and equipment and intangible assets (net of vehicles sold under buy-back commitments)
(14) - (30) -
Investments (9) - (20) -
Other non-cash items (37) 366 6 253 7
Dividends received 53 53 84 84
Change in provisions 96 8 (161) (3)
Change in deferred taxes (179) - (490) -
Change in items due to buy-back commitments (37) (58) - (88) -
Change in operating lease items (37) (41) - (147) -
Change in working capital 2,562 (126) (3,767) (323)
TOTAL 4,601 166
D) CASH FLOWS FROM (USED IN) INVESTMENT ACTIVITIES:
Investments in:
Tangible and intangible assets (net of vehicles sold under buy-back commitments and leased assets)
(3,386) - (4,979) (12)
Investments in consolidated subsidiaries (3) - (62) -
Other investments (102) (62) (86) (82)
Proceeds from the sale of:
Property, plant and equipment and intangible assets (net of vehicles sold under buy-back commitments)
87 - 176 -
Investments in consolidated subsidiaries 16 - - -
Other investments 5 - 58 -
Net change in receivables from financing activities 882 (22) (1,493) 106
Change in current securities (27) - 118 -
Other changes (31) - 176 -
TOTAL (2,559) (6,092)
E) CASH FLOWS FROM (USED IN) FINANCING ACTIVITIES:
New issuance of bonds 4,917 - 50 -
Repayment of bonds (526) - (225) -
Issuance of other medium-term borrowings 3,178 - 3,601 -
Repayment of other medium-term borrowings (1,357) - (1,136) -
Net change in other financial payables and other financial assets/liabilities 83 319 1,606 256
Increase in share capital 13 - 15 -
(Buy-back) sale of treasury shares - - (238) -
Dividends paid (27) - (546) (146)
TOTAL 6,281 3,127
Translation exchange differences 220 (159)
F) TOTAL CHANGE IN CASH AND CASH EQUIVALENTS 8,543 (2,958)
G) CASH AND CASH EQUIVALENTS AT END OF THE YEAR (22) 12,226 3,683
of which: Cash and cash equivalents included as Assets held for sale - - - -
H) CASH AND CASH EQUIVALENTS AT END OF PERIOD AS REPORTED (22) 12,226 3,683