Chrysler 2009 Annual Report Download - page 163
Download and view the complete annual report
Please find page 163 of the 2009 Chrysler annual report below. You can navigate through the pages in the report by either clicking on the pages listed below, or by using the keyword search tool below to find specific information within the annual report.-
 1
1 -
2
-
3
-
4
-
5
-
6
-
7
-
8
-
9
-
10
-
11
-
12
-
13
-
14
-
15
-
16
-
17
-
18
-
19
-
20
-
21
-
22
-
23
-
24
-
25
-
26
-
27
-
28
-
29
-
30
-
31
-
32
-
33
-
34
-
35
-
36
-
37
-
38
-
39
-
40
-
41
-
42
-
43
-
44
-
45
-
46
-
47
-
48
-
49
-
50
-
51
-
52
-
53
-
54
-
55
-
56
-
57
-
58
-
59
-
60
-
61
-
62
-
63
-
64
-
65
-
66
-
67
-
68
-
69
-
70
-
71
-
72
-
73
-
74
-
75
-
76
-
77
-
78
-
79
-
80
-
81
-
82
-
83
-
84
-
85
-
86
-
87
-
88
-
89
-
90
-
91
-
92
-
93
-
94
-
95
-
96
-
97
-
98
-
99
-
100
-
101
-
102
-
103
-
104
-
105
-
106
-
107
-
108
-
109
-
110
-
111
-
112
-
113
-
114
-
115
-
116
-
117
-
118
-
119
-
120
-
121
-
122
-
123
-
124
-
125
-
126
-
127
-
128
-
129
-
130
-
131
-
132
-
133
-
134
-
135
-
136
-
137
-
138
-
139
-
140
-
141
-
142
-
143
-
144
-
145
-
146
-
147
-
148
-
149
-
150
-
151
-
152
-
 153
153 -
 154
154 -
 155
155 -
 156
156 -
 157
157 -
 158
158 -
 159
159 -
 160
160 -
 161
161 -
 162
162 -
 163
163 -
 164
164 -
 165
165 -
 166
166 -
 167
167 -
 168
168 -
 169
169 -
 170
170 -
 171
171 -
 172
172 -
 173
173 -
174
-
175
-
176
-
177
-
178
-
179
-
180
-
181
-
182
-
183
-
184
-
185
-
186
-
187
-
188
-
189
-
190
-
191
-
192
-
193
-
194
-
195
-
196
-
197
-
198
-
199
-
200
-
201
-
202
-
203
-
204
-
205
-
206
-
207
-
208
-
209
-
210
-
211
-
212
-
213
-
214
-
215
-
216
-
217
-
218
-
219
-
220
-
221
-
222
-
223
-
224
-
225
-
226
-
227
-
228
-
229
-
230
-
231
-
232
-
233
-
234
-
235
-
236
-
237
-
238
-
239
-
240
-
241
-
242
-
243
-
244
-
245
-
246
-
247
-
248
-
249
-
250
-
251
-
252
-
253
-
254
-
255
-
256
-
257
-
258
-
259
-
260
-
261
-
262
-
263
-
264
-
265
-
266
-
267
-
268
-
269
-
270
-
271
-
272
-
273
-
274
-
275
-
276
-
277
-
278
-
279
-
280
-
281
-
282
-
283
-
284
-
285
-
286
-
287
-
288
-
289
-
290
-
291
-
292
-
293
-
294
-
295
-
296
-
297
-
298
-
299
-
300
-
301
-
302
-
303
-
304
-
305
-
306
-
307
-
308
-
309
-
310
-
311
-
312
-
313
-
314
-
315
-
316
-
317
-
318
-
319
-
320
-
321
-
322
-
323
-
324
-
325
-
326
-
327
-
328
-
329
-
330
-
331
-
332
-
333
-
334
-
335
-
336
-
337
-
338
-
339
-
340
-
341
-
342
-
343
-
344
-
345
-
346
-
347
-
348
-
349
-
350
-
351
-
352
-
353
-
354
-
355
-
356
-
357
-
358
-
359
-
360
-
361
-
362
-
363
-
364
-
365
-
366
-
367
-
368
-
369
-
370
-
371
-
372
-
373
-
374
 |
 |

162 FIAT GROUP
CONSOLIDATED
FINANCIAL
STATEMENTS
AT 31 DECEMBER
2009
NOTES
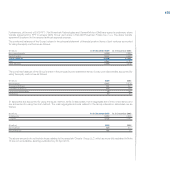
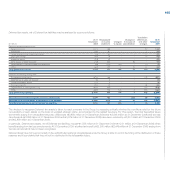
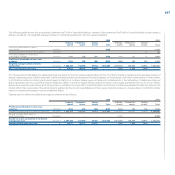
Financial income (expenses) 9.
In addition to the items included in the specific lines of the income statement, Net financial income (expenses) in 2009 also includes the Interest income from
customers and other financial income of financial services companies included in Net revenues for€918 million (€959 million in 2008) and Interest cost and
other financial charges from financial services companies included in Cost of sales for€804 million (€777 million in 2008).
Reconciliation to the income statement is provided at the foot of the following table.
(€ million) 2009 2008
Financial income:
Interest income and other financial income 153 229
Interest income from customers and other financial income of financial services companies 918 959
Gains on disposal of securities 7 2
Total Financial income 1,078 1,190
of which:
Financial income, excluding financial services companies (a) 160 231
Interest cost and other financial expenses:
Interest expense and other financial expenses 1,437 1,371
Write-downs of financial assets 194 121
Losses on disposal of securities 12 7
Interest costs on employee benefits 160 155
Total Interest and other financial expenses 1,803 1,654
Net income (expenses) from derivative financial instruments and exchange differences 86 (301)
of which:
Interest cost and other financial expenses, effects resulting from derivative financial instruments and exchange
differences, excluding financial services companies (b) 913 1,178
Net financial income (expenses) excluding financial services companies (a) – (b) (753) (947)
Net financial expenses in 2009 (excluding financial services companies) totalled€753 million, and include net financial income of€117 million arising from
the equity swaps on Fiat shares, relating to certain stock option plans (see Note 21 for further details). Net financial expense of€947 million in 2008 included
a net expense of€263 million arising from the above mentioned equity swaps on Fiat shares.
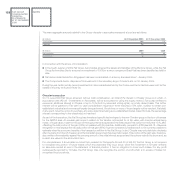
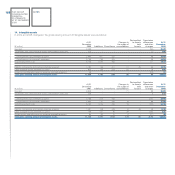
Interest income and other financial income may be analysed as follows:
(€ million) 2009 2008
Interest income from banks 62 123
Interest income from securities 9 9
Commission income 1 -
Other interest income and financial income 81 97
Total Interest income and other financial income 153 229