Chrysler 2009 Annual Report Download - page 70
Download and view the complete annual report
Please find page 70 of the 2009 Chrysler annual report below. You can navigate through the pages in the report by either clicking on the pages listed below, or by using the keyword search tool below to find specific information within the annual report.-
 1
1 -
2
-
3
-
4
-
5
-
6
-
7
-
8
-
9
-
10
-
11
-
12
-
13
-
14
-
15
-
16
-
17
-
18
-
19
-
20
-
21
-
22
-
23
-
24
-
25
-
26
-
27
-
28
-
29
-
30
-
31
-
32
-
33
-
34
-
35
-
36
-
37
-
38
-
39
-
40
-
41
-
42
-
43
-
44
-
45
-
46
-
47
-
48
-
49
-
50
-
51
-
52
-
53
-
54
-
55
-
56
-
57
-
58
-
59
-
 60
60 -
 61
61 -
 62
62 -
 63
63 -
 64
64 -
 65
65 -
 66
66 -
 67
67 -
 68
68 -
 69
69 -
 70
70 -
 71
71 -
 72
72 -
 73
73 -
 74
74 -
 75
75 -
 76
76 -
 77
77 -
 78
78 -
 79
79 -
 80
80 -
81
-
82
-
83
-
84
-
85
-
86
-
87
-
88
-
89
-
90
-
91
-
92
-
93
-
94
-
95
-
96
-
97
-
98
-
99
-
100
-
101
-
102
-
103
-
104
-
105
-
106
-
107
-
108
-
109
-
110
-
111
-
112
-
113
-
114
-
115
-
116
-
117
-
118
-
119
-
120
-
121
-
122
-
123
-
124
-
125
-
126
-
127
-
128
-
129
-
130
-
131
-
132
-
133
-
134
-
135
-
136
-
137
-
138
-
139
-
140
-
141
-
142
-
143
-
144
-
145
-
146
-
147
-
148
-
149
-
150
-
151
-
152
-
153
-
154
-
155
-
156
-
157
-
158
-
159
-
160
-
161
-
162
-
163
-
164
-
165
-
166
-
167
-
168
-
169
-
170
-
171
-
172
-
173
-
174
-
175
-
176
-
177
-
178
-
179
-
180
-
181
-
182
-
183
-
184
-
185
-
186
-
187
-
188
-
189
-
190
-
191
-
192
-
193
-
194
-
195
-
196
-
197
-
198
-
199
-
200
-
201
-
202
-
203
-
204
-
205
-
206
-
207
-
208
-
209
-
210
-
211
-
212
-
213
-
214
-
215
-
216
-
217
-
218
-
219
-
220
-
221
-
222
-
223
-
224
-
225
-
226
-
227
-
228
-
229
-
230
-
231
-
232
-
233
-
234
-
235
-
236
-
237
-
238
-
239
-
240
-
241
-
242
-
243
-
244
-
245
-
246
-
247
-
248
-
249
-
250
-
251
-
252
-
253
-
254
-
255
-
256
-
257
-
258
-
259
-
260
-
261
-
262
-
263
-
264
-
265
-
266
-
267
-
268
-
269
-
270
-
271
-
272
-
273
-
274
-
275
-
276
-
277
-
278
-
279
-
280
-
281
-
282
-
283
-
284
-
285
-
286
-
287
-
288
-
289
-
290
-
291
-
292
-
293
-
294
-
295
-
296
-
297
-
298
-
299
-
300
-
301
-
302
-
303
-
304
-
305
-
306
-
307
-
308
-
309
-
310
-
311
-
312
-
313
-
314
-
315
-
316
-
317
-
318
-
319
-
320
-
321
-
322
-
323
-
324
-
325
-
326
-
327
-
328
-
329
-
330
-
331
-
332
-
333
-
334
-
335
-
336
-
337
-
338
-
339
-
340
-
341
-
342
-
343
-
344
-
345
-
346
-
347
-
348
-
349
-
350
-
351
-
352
-
353
-
354
-
355
-
356
-
357
-
358
-
359
-
360
-
361
-
362
-
363
-
364
-
365
-
366
-
367
-
368
-
369
-
370
-
371
-
372
-
373
-
374
 |
 |

69
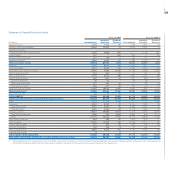
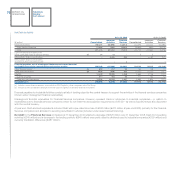
Statement of Financial Position by Activity
At 31.12.2009 At 31.12.2008 (*)
Industrial Financial Industrial Financial
(€ million)
Consolidated Activities Services Consolidated Activities Services
Intangible assets 7,199 7,103 96 7,048 6,950 98
Property, plant and equipment 12,945 12,939 6 12,515 12,509 6
Investment property - - - - - -
Investments and other financial assets 2,159 3,968 944 2,177 3,756 987
Leased assets 457 7 450 505 11 494
Defined benefit plan assets 144 140 4 120 116 4
Deferred tax assets 2,580 2,433 147 2,386 2,225 161
Total non-current assets 25,484 26,590 1,647 24,751 25,567 1,750
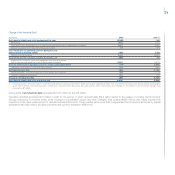
Inventory 8,748 8,614 134 11,438 11,341 97
Trade receivables 3,649 3,590 121 4,390 4,301 235
Receivables from financing activities 12,695 5,506 13,368 13,136 6,448 13,420
Current taxes receivable 674 650 24 770 761 15
Other current assets 2,778 2,514 296 2,600 2,443 188
Current financial assets 899 827 76 967 908 62
Current investments 46 46 - 26 26 -
Other current securities 217 164 53 177 134 43
Other financial assets 636 617 23 764 748 19
Cash and cash equivalents 12,226 10,819 1,407 3,683 2,604 1,079
Total current assets 41,669 32,520 15,426 36,984 28,806 15,096
Assets held for sale 82 79 10 37 30 7
TOTAL ASSETS 67,235 59,189 17,083 61,772 54,403 16,853
Total assets adjusted for asset-backed financing transactions 60,149 58,725 10,428 55,109 53,734 10,839
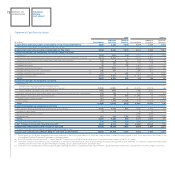
Equity 11,115 11,115 2,756 11,101 11,101 2,565
Provisions 8,432 8,333 99 8,144 7,989 155
Employee benefits 3,447 3,431 16 3,366 3,351 15
Other provisions 4,985 4,902 83 4,778 4,638 140
Financial payables 28,527 20,898 13,812 21,379 14,522 13,590
Asset-backed financing 7,086 464 6,655 6,663 669 6,014
Other 21,441 20,434 7,157 14,716 13,853 7,576
Other financial liabilities 464 420 48 1,202 1,078 127
Trade payables 12,295 12,253 108 13,258 13,216 189
Current taxes payable 377 347 32 331 276 55
Deferred tax liabilities 152 148 4 170 169 1
Other current liabilities 5,865 5,675 216 6,185 6,052 169
Liabilities held for sale 8 - 8 2 - 2
TOTAL EQUITY AND LIABILITIES 67,235 59,189 17,083 61,772 54,403 16,853
Total equity and liabilities adjusted for asset-backed financing transactions 60,149 58,725 10,428 55,109 53,734 10,839
(*) Following adoption of the improvement to IAS 16 in 2009, as described in the Notes to the Consolidated Financial Statements, the amount originally reported for Property, Plant and Equipment at
31 December 2008 was reduced by €92 million (entirely relating to Industrial Activities) and Inventory was increased by the same amount.