Chrysler 2009 Annual Report Download - page 173
Download and view the complete annual report
Please find page 173 of the 2009 Chrysler annual report below. You can navigate through the pages in the report by either clicking on the pages listed below, or by using the keyword search tool below to find specific information within the annual report.-
 1
1 -
2
-
3
-
4
-
5
-
6
-
7
-
8
-
9
-
10
-
11
-
12
-
13
-
14
-
15
-
16
-
17
-
18
-
19
-
20
-
21
-
22
-
23
-
24
-
25
-
26
-
27
-
28
-
29
-
30
-
31
-
32
-
33
-
34
-
35
-
36
-
37
-
38
-
39
-
40
-
41
-
42
-
43
-
44
-
45
-
46
-
47
-
48
-
49
-
50
-
51
-
52
-
53
-
54
-
55
-
56
-
57
-
58
-
59
-
60
-
61
-
62
-
63
-
64
-
65
-
66
-
67
-
68
-
69
-
70
-
71
-
72
-
73
-
74
-
75
-
76
-
77
-
78
-
79
-
80
-
81
-
82
-
83
-
84
-
85
-
86
-
87
-
88
-
89
-
90
-
91
-
92
-
93
-
94
-
95
-
96
-
97
-
98
-
99
-
100
-
101
-
102
-
103
-
104
-
105
-
106
-
107
-
108
-
109
-
110
-
111
-
112
-
113
-
114
-
115
-
116
-
117
-
118
-
119
-
120
-
121
-
122
-
123
-
124
-
125
-
126
-
127
-
128
-
129
-
130
-
131
-
132
-
133
-
134
-
135
-
136
-
137
-
138
-
139
-
140
-
141
-
142
-
143
-
144
-
145
-
146
-
147
-
148
-
149
-
150
-
151
-
152
-
153
-
154
-
155
-
156
-
157
-
158
-
159
-
160
-
161
-
162
-
 163
163 -
 164
164 -
 165
165 -
 166
166 -
 167
167 -
 168
168 -
 169
169 -
 170
170 -
 171
171 -
 172
172 -
 173
173 -
 174
174 -
 175
175 -
 176
176 -
 177
177 -
 178
178 -
 179
179 -
 180
180 -
 181
181 -
 182
182 -
 183
183 -
184
-
185
-
186
-
187
-
188
-
189
-
190
-
191
-
192
-
193
-
194
-
195
-
196
-
197
-
198
-
199
-
200
-
201
-
202
-
203
-
204
-
205
-
206
-
207
-
208
-
209
-
210
-
211
-
212
-
213
-
214
-
215
-
216
-
217
-
218
-
219
-
220
-
221
-
222
-
223
-
224
-
225
-
226
-
227
-
228
-
229
-
230
-
231
-
232
-
233
-
234
-
235
-
236
-
237
-
238
-
239
-
240
-
241
-
242
-
243
-
244
-
245
-
246
-
247
-
248
-
249
-
250
-
251
-
252
-
253
-
254
-
255
-
256
-
257
-
258
-
259
-
260
-
261
-
262
-
263
-
264
-
265
-
266
-
267
-
268
-
269
-
270
-
271
-
272
-
273
-
274
-
275
-
276
-
277
-
278
-
279
-
280
-
281
-
282
-
283
-
284
-
285
-
286
-
287
-
288
-
289
-
290
-
291
-
292
-
293
-
294
-
295
-
296
-
297
-
298
-
299
-
300
-
301
-
302
-
303
-
304
-
305
-
306
-
307
-
308
-
309
-
310
-
311
-
312
-
313
-
314
-
315
-
316
-
317
-
318
-
319
-
320
-
321
-
322
-
323
-
324
-
325
-
326
-
327
-
328
-
329
-
330
-
331
-
332
-
333
-
334
-
335
-
336
-
337
-
338
-
339
-
340
-
341
-
342
-
343
-
344
-
345
-
346
-
347
-
348
-
349
-
350
-
351
-
352
-
353
-
354
-
355
-
356
-
357
-
358
-
359
-
360
-
361
-
362
-
363
-
364
-
365
-
366
-
367
-
368
-
369
-
370
-
371
-
372
-
373
-
374
 |
 |

172 FIAT GROUP
CONSOLIDATED
FINANCIAL
STATEMENTS
AT 31 DECEMBER
2009
NOTES
Expected cash flows used under this method are developed in conjunction with the budgeting and forecasting process of the Sector and represent the
most likely amounts and timing of future cash flows based on the long range plan of CNH. The long range plan is updated annually and is reviewed by
the senior management of CNH. Expected sales growth is based on CNH management’s forecast. The operating costs considered in the expected cash
flows are also based on management’s five-year forecast and supported by the manufacturing plans and product development of the Sector. The amount
of capital expenditures and working capital considered in the expected cash flows are based on several factors including the estimated levels required to
support the projected level of growth and product development plan.
CNH projections are based on an expectation of a further agricultural equipment industry retail unit sales declines in 2010, followed by industry growth
in 2011 and subsequent years. Construction equipments industry retail unit sales are expected to improve slightly in 2010, followed by more significant
growth in 2011 and subsequent years.
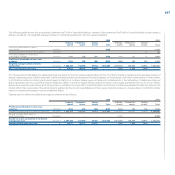
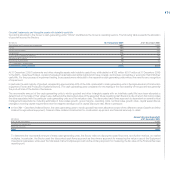
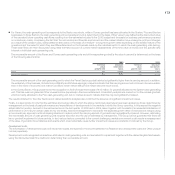
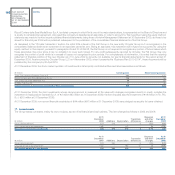
The discount rates used in the discounted cash flows approach are an estimate of the rate of return that a market participant would expect of each cash-
generating unit. To select an appropriate rate for discounting the future earnings stream, a review was made of short-term interest rates and the yields
of long-term corporate and government bonds, as well as the typical capital structure of companies in the industry. The discount rates used for each
cash-generating unit have been suitably increased to take account of the risk inherent in the cash flow projections, as well as the risk level that would be
perceived by a market participant. Considering the above mentioned factors, the following discount rates as of 31 December 2009 have been selected
by CNH:
2009 2008
Agricultural equipment 20.8% - 21.1% 16.1% - 17.5%
Construction equipment 19.2% 14.3% - 15.8%
A terminal value is included at the end of the projection period used in the discounted cash flow analyses in order to reflect the remaining value that each
cash-generating unit is expected to generate. The terminal value represents the present value in the last year of the projection period of all subsequent
cash flows into perpetuity. The terminal value growth rate is a key assumption used in determining the terminal value as it represents the annual growth
of all subsequent cash flows into perpetuity. The terminal value growth rates selected in 2009 and 2008 for the Agricultural equipment cash-generating
unit is 1% and those selected for the Construction equipment cash generating unit is 2%.
The total asset market multiples were utilised in determining the fair value of the Financial Services reporting unit under the market approach. CNH used
the market approach as the primary approach to measure the fair value of the Financial Services reporting unit as it derives value based primarily on the
assets under management. The market approach measures fair value based on prices and other relevant information generated by market transactions
involving identical or comparable assets or liabilities. Under this approach, CNH makes use of market price data of corporations whose stock is actively
traded in a public, free and open market, either on an exchange or over-the counter basis. Although it is clear no two companies are entirely alike, the
corporations selected as guideline companies must be engaged in the same or similar line of business or are subject to similar financial and business risks,
including the opportunity for growth.
The values obtained for the New Holland (Agricultural equipment business) and New Holland Construction (Construction equipment business) cash
generating units using the discounted cash flow method were only slightly higher than their carrying amounts. As a result, revenue and EBITDA market
multiples were utilised in determining the fair value of the Equipment Operations cash generating units as a secondary approach to further support the
discounted cash flow approach. Because the market approach does not evaluate the CNH cash generating units’ projected cash flows, the Sector
management believes the market approach enables verification of the implied multiples derived from the discounted cash flows approach using market
benchmarks. The CNH management identified comparable companies by reviewing all publicly traded companies operating in the CNH lines of business.
The comparable companies used were determined based on an evaluation of all relevant factors, including whether the companies were subject to similar
financial and business risks.
The fair values of each of the five cash-generating units calculated using the two above methods in any case exceeded their carrying amounts and their
values determined using the discounted cash flow method at 31 December 2009.