Chrysler 2009 Annual Report Download - page 178
Download and view the complete annual report
Please find page 178 of the 2009 Chrysler annual report below. You can navigate through the pages in the report by either clicking on the pages listed below, or by using the keyword search tool below to find specific information within the annual report.-
 1
1 -
2
-
3
-
4
-
5
-
6
-
7
-
8
-
9
-
10
-
11
-
12
-
13
-
14
-
15
-
16
-
17
-
18
-
19
-
20
-
21
-
22
-
23
-
24
-
25
-
26
-
27
-
28
-
29
-
30
-
31
-
32
-
33
-
34
-
35
-
36
-
37
-
38
-
39
-
40
-
41
-
42
-
43
-
44
-
45
-
46
-
47
-
48
-
49
-
50
-
51
-
52
-
53
-
54
-
55
-
56
-
57
-
58
-
59
-
60
-
61
-
62
-
63
-
64
-
65
-
66
-
67
-
68
-
69
-
70
-
71
-
72
-
73
-
74
-
75
-
76
-
77
-
78
-
79
-
80
-
81
-
82
-
83
-
84
-
85
-
86
-
87
-
88
-
89
-
90
-
91
-
92
-
93
-
94
-
95
-
96
-
97
-
98
-
99
-
100
-
101
-
102
-
103
-
104
-
105
-
106
-
107
-
108
-
109
-
110
-
111
-
112
-
113
-
114
-
115
-
116
-
117
-
118
-
119
-
120
-
121
-
122
-
123
-
124
-
125
-
126
-
127
-
128
-
129
-
130
-
131
-
132
-
133
-
134
-
135
-
136
-
137
-
138
-
139
-
140
-
141
-
142
-
143
-
144
-
145
-
146
-
147
-
148
-
149
-
150
-
151
-
152
-
153
-
154
-
155
-
156
-
157
-
158
-
159
-
160
-
161
-
162
-
163
-
164
-
165
-
166
-
167
-
 168
168 -
 169
169 -
 170
170 -
 171
171 -
 172
172 -
 173
173 -
 174
174 -
 175
175 -
 176
176 -
 177
177 -
 178
178 -
 179
179 -
 180
180 -
 181
181 -
 182
182 -
 183
183 -
 184
184 -
 185
185 -
 186
186 -
 187
187 -
 188
188 -
189
-
190
-
191
-
192
-
193
-
194
-
195
-
196
-
197
-
198
-
199
-
200
-
201
-
202
-
203
-
204
-
205
-
206
-
207
-
208
-
209
-
210
-
211
-
212
-
213
-
214
-
215
-
216
-
217
-
218
-
219
-
220
-
221
-
222
-
223
-
224
-
225
-
226
-
227
-
228
-
229
-
230
-
231
-
232
-
233
-
234
-
235
-
236
-
237
-
238
-
239
-
240
-
241
-
242
-
243
-
244
-
245
-
246
-
247
-
248
-
249
-
250
-
251
-
252
-
253
-
254
-
255
-
256
-
257
-
258
-
259
-
260
-
261
-
262
-
263
-
264
-
265
-
266
-
267
-
268
-
269
-
270
-
271
-
272
-
273
-
274
-
275
-
276
-
277
-
278
-
279
-
280
-
281
-
282
-
283
-
284
-
285
-
286
-
287
-
288
-
289
-
290
-
291
-
292
-
293
-
294
-
295
-
296
-
297
-
298
-
299
-
300
-
301
-
302
-
303
-
304
-
305
-
306
-
307
-
308
-
309
-
310
-
311
-
312
-
313
-
314
-
315
-
316
-
317
-
318
-
319
-
320
-
321
-
322
-
323
-
324
-
325
-
326
-
327
-
328
-
329
-
330
-
331
-
332
-
333
-
334
-
335
-
336
-
337
-
338
-
339
-
340
-
341
-
342
-
343
-
344
-
345
-
346
-
347
-
348
-
349
-
350
-
351
-
352
-
353
-
354
-
355
-
356
-
357
-
358
-
359
-
360
-
361
-
362
-
363
-
364
-
365
-
366
-
367
-
368
-
369
-
370
-
371
-
372
-
373
-
374
 |
 |

177
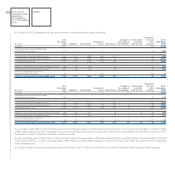
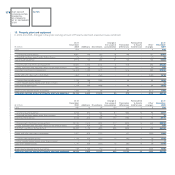
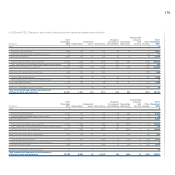
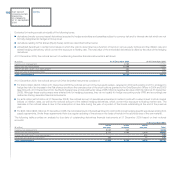
At 31 Change in Reclassified At 31
December Impairment the scope of Translation to Assets Other December
(€ million) 2007 Additions Depreciation losses Divestitures consolidation differences held for sale changes 2008
Land 475 10 - - (4) 109 (13) 3 8 588
Owned industrial buildings 2,309 342 (147) (8) (5) 69 (99) 13 97 2,571
Industrial buildings leased
under finance leases 59 1 (3) - (2) 4 - - (1) 58
Total Industrial buildings 2,368 343 (150) (8) (7) 73 (99) 13 96 2,629
Owned plant, machinery
and equipment 5,918 1,619 (1,559) (27) (31) 142 (244) 1 448 6,267
Plant, machinery and equipment
leased under finance leases 187 104 (49) - - 9 (3) - - 248
Total Plant, machinery
and equipment 6,105 1,723 (1,608) (27) (31) 151 (247) 1 448 6,515
Assets sold with a buy-back
commitment 1,096 406 (143) (12) (70) - (31) - (184) 1,062
Owned other tangible assets 418 254 (120) (1) (89) 8 (17) 1 11 465
Other tangible assets leased
under finance leases 3 2 (1) - - - - - - 4
Total Other tangible assets 421 256 (121) (1) (89) 8 (17) 1 11 469
Advances and tangible assets
in progress 747 1,156 - (2) (10) 2 (86) - (555) 1,252
Total net carrying amount of Property,
plant and equipment 11,212 3,894 (2,022) (50) (211) 343 (493) 18 (176) 12,515
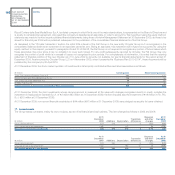
Additions of€2,440 million in 2009 mainly relate to the Fiat Group Automobiles, FPT Powertrain Technologies, Iveco, Magneti Marelli, CNH – Case New
Holland and Ferrari Sectors.
During 2009 the Trucks and Commercial Vehicles Sector recognised impairment losses on Assets sold with a buy-back commitment from for an amount
of€32 million (€12 million in 2008) in order to align their carrying amount to market value. These losses are recognised in Cost of sales for an amount of
€24 million (€8 million in 2008) in Other unusual income (expenses) for an amount of€8 million (€4 million in 2008). In addition, in 2009 the Group reviewed
the recoverable amount of certain buildings, plant, machinery and industrial equipment in order to determine whether there was any reduction in value arising
from technical obsolescence from the negative effects expected in the market in which those assets will be used or from the restructuring plans drawn up
for certain businesses. This assessment led to the recognition of impairment losses of€174 million (€38 million in 2008), of which€34 million has been
recognised in Trading profit/(loss) (€24 million in 2008),€24 million as Restructuring costs (€14 million in 2008) and€116 million in Other unusual income
(expenses).
In 2009 the column Other changes includes the reversal of previously recognised impairment losses of€8 million in 2009 (€17 million in 2008). This column
also includes the reclassification of the prior year balances for Advances and tangible assets in progress to the appropriate categories when the assets were
effectively acquired and put into operation, as well as the reclassification to Inventory of Assets sold wit a buy-back commitment that are held for sale at the
agreement expiry date for€165 million in 2009 (€189 million in 2008).
In 2009, the Column change in the scope of consolidation, showing an overall increase of€53 million, mainly reflects the line-by-line consolidation of the
entity Fiat Automobiles Serbia Doo Kragujevac. In 2008 the column Change in the scope of consolidation included an overall net increase of€343 million,
which mainly reflected the line-by-line consolidation of the Ergom group (€280 million) and of Tritec Motors Ltda (now FPT Powertrain do Brasil – Industria
e Comércio de Motores Ltda) (€57 million).