Chrysler 2009 Annual Report Download - page 59
Download and view the complete annual report
Please find page 59 of the 2009 Chrysler annual report below. You can navigate through the pages in the report by either clicking on the pages listed below, or by using the keyword search tool below to find specific information within the annual report.-
 1
1 -
2
-
3
-
4
-
5
-
6
-
7
-
8
-
9
-
10
-
11
-
12
-
13
-
14
-
15
-
16
-
17
-
18
-
19
-
20
-
21
-
22
-
23
-
24
-
25
-
26
-
27
-
28
-
29
-
30
-
31
-
32
-
33
-
34
-
35
-
36
-
37
-
38
-
39
-
40
-
41
-
42
-
43
-
44
-
45
-
46
-
47
-
48
-
 49
49 -
 50
50 -
 51
51 -
 52
52 -
 53
53 -
 54
54 -
 55
55 -
 56
56 -
 57
57 -
 58
58 -
 59
59 -
 60
60 -
 61
61 -
 62
62 -
 63
63 -
 64
64 -
 65
65 -
 66
66 -
 67
67 -
 68
68 -
 69
69 -
70
-
71
-
72
-
73
-
74
-
75
-
76
-
77
-
78
-
79
-
80
-
81
-
82
-
83
-
84
-
85
-
86
-
87
-
88
-
89
-
90
-
91
-
92
-
93
-
94
-
95
-
96
-
97
-
98
-
99
-
100
-
101
-
102
-
103
-
104
-
105
-
106
-
107
-
108
-
109
-
110
-
111
-
112
-
113
-
114
-
115
-
116
-
117
-
118
-
119
-
120
-
121
-
122
-
123
-
124
-
125
-
126
-
127
-
128
-
129
-
130
-
131
-
132
-
133
-
134
-
135
-
136
-
137
-
138
-
139
-
140
-
141
-
142
-
143
-
144
-
145
-
146
-
147
-
148
-
149
-
150
-
151
-
152
-
153
-
154
-
155
-
156
-
157
-
158
-
159
-
160
-
161
-
162
-
163
-
164
-
165
-
166
-
167
-
168
-
169
-
170
-
171
-
172
-
173
-
174
-
175
-
176
-
177
-
178
-
179
-
180
-
181
-
182
-
183
-
184
-
185
-
186
-
187
-
188
-
189
-
190
-
191
-
192
-
193
-
194
-
195
-
196
-
197
-
198
-
199
-
200
-
201
-
202
-
203
-
204
-
205
-
206
-
207
-
208
-
209
-
210
-
211
-
212
-
213
-
214
-
215
-
216
-
217
-
218
-
219
-
220
-
221
-
222
-
223
-
224
-
225
-
226
-
227
-
228
-
229
-
230
-
231
-
232
-
233
-
234
-
235
-
236
-
237
-
238
-
239
-
240
-
241
-
242
-
243
-
244
-
245
-
246
-
247
-
248
-
249
-
250
-
251
-
252
-
253
-
254
-
255
-
256
-
257
-
258
-
259
-
260
-
261
-
262
-
263
-
264
-
265
-
266
-
267
-
268
-
269
-
270
-
271
-
272
-
273
-
274
-
275
-
276
-
277
-
278
-
279
-
280
-
281
-
282
-
283
-
284
-
285
-
286
-
287
-
288
-
289
-
290
-
291
-
292
-
293
-
294
-
295
-
296
-
297
-
298
-
299
-
300
-
301
-
302
-
303
-
304
-
305
-
306
-
307
-
308
-
309
-
310
-
311
-
312
-
313
-
314
-
315
-
316
-
317
-
318
-
319
-
320
-
321
-
322
-
323
-
324
-
325
-
326
-
327
-
328
-
329
-
330
-
331
-
332
-
333
-
334
-
335
-
336
-
337
-
338
-
339
-
340
-
341
-
342
-
343
-
344
-
345
-
346
-
347
-
348
-
349
-
350
-
351
-
352
-
353
-
354
-
355
-
356
-
357
-
358
-
359
-
360
-
361
-
362
-
363
-
364
-
365
-
366
-
367
-
368
-
369
-
370
-
371
-
372
-
373
-
374
 |
 |

REPORT ON
OPERATIONS
FINANCIAL
REVIEW -
FIAT GROUP
58
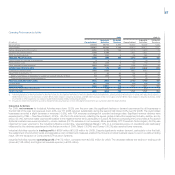
In Brazil, where overall demand rose 12.6%, deliveries for cars and light commercial vehicles increased 12.6% over 2008. FGA maintained its leadership
of the market, recording a 24.5% share.
Maserati reported revenues of €448 million, down 45.7% over the previous year. A total of 4,489 cars were delivered to the network during the year,
representing a 48.7% year-on-year decrease attributable to the significant decline in demand in the company’s reference markets. Maserati maintained
its overall market share, with an improvement in the Quattroporte segment.
Ferrari had revenues of €1,778 million, down 7.4% over 2008 due to lower sales volumes and a less favourable sales mix. A total of 6,235 vehicles were
delivered to the network during the year, a decrease of 4.5% against an approximate 35% drop for Ferrari’s reference segment globally. The level of deliveries
for 8-cylinder vehicles benefited from the success of the Ferrari California.
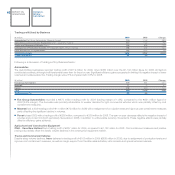
Agricultural and Construction Equipment
CNH – Case New Holland had revenues of €10,107 million for 2009, a decrease of 20.9% over 2008 (-25% in US dollar terms), reflecting the severe
global construction equipment industry decline and weaker market conditions in the agricultural business (compared to record high 2008 levels, particularly
for combines). Revenues from construction equipment sales were also impacted by heavy destocking actions both at company and dealer level. For
agricultural equipment, revenues were down slightly in North America, with decreases in tractor sales and network destocking actions being partially offset
by stronger combine sales. Declines in the remaining regions were attributable to an overall decline for the industry, network destocking actions and tight
credit markets.
In 2009, the global market for agricultural equipment decreased 7%, with declines in retail unit volumes for tractors and combines of 7% and 19%,
respectively, compared to exceptionally strong 2008 volumes. CNH’s extensive and upgraded product portfolio supported market share performance in an
increasingly competitive environment. In the tractor market, CNH gained share in North America in over 40 hp models. Share in Latin America and Western
Europe remained flat. Market share was eroded in Rest-of-World, where demand in fast growing markets such as China is mainly satisfied by local, low-
range products. In the global market for combine harvesters, CNH share increased in Latin America, was stable in Rest-of-World and in Western Europe,
and decreased in North America (with gains in the more profitable higher-end segment).
Worldwide construction equipment industry retail unit sales dropped 38%. CNH market share improved in Latin America for both light and heavy segments,
while North America was stable. Share declined for both segments in Rest-of-World (where CNH has a limited presence) and Western Europe, in a highly
competitive environment driven by aggressive destocking actions.
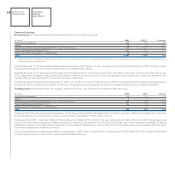
Trucks and Commercial Vehicles
Iveco reported 2009 revenues of €7,183 million, down 34.1% year-over-year, with lower sales volumes reflecting the negative market trend,
particularly in Europe.
Iveco delivered 103,866 vehicles, a decrease of 45.9% over 2008. A total of 66,754 vehicles were delivered in Western Europe (-46.7%), with declines in all
major markets: Italy (-30.7%), Germany (-43.3%), France (-45.9%), Spain (-60.3%) and the UK (-73.1%). Deliveries were down 72.6% in Eastern Europe,
while the decline in Latin America was contained at 19.1%.
The Sector’s market share in Western Europe (GVW ≥ 2.8 tonnes) stood at 9.2% (down 0.7 percentage points vs. 2008) with declines in all segments.
Share was down 0.5 percentage points in the light segment, heavily influenced by the performance in France, but up in Italy and Spain (+0.4 percentage
points and +0.8 percentage points, respectively). For the medium segment, share decreased 0.7 percentage points, notwithstanding gains in Italy and
France. In the heavy segment, share declined 1.1 percentage points, attributable entirely to an unfavourable market mix, which more than offset positive
performances in Italy (+0.6 percentage points), France (+0.4 percentage points) and Spain (+2.7 percentage points).
Market share in Eastern Europe (GVW ≥ 2.8 tonnes) was 10.7% (-1.1 percentage points over 2008), with share holding for heavy vehicles and declining
for light and medium vehicles.