Chrysler 2009 Annual Report Download - page 200
Download and view the complete annual report
Please find page 200 of the 2009 Chrysler annual report below. You can navigate through the pages in the report by either clicking on the pages listed below, or by using the keyword search tool below to find specific information within the annual report.-
 1
1 -
2
-
3
-
4
-
5
-
6
-
7
-
8
-
9
-
10
-
11
-
12
-
13
-
14
-
15
-
16
-
17
-
18
-
19
-
20
-
21
-
22
-
23
-
24
-
25
-
26
-
27
-
28
-
29
-
30
-
31
-
32
-
33
-
34
-
35
-
36
-
37
-
38
-
39
-
40
-
41
-
42
-
43
-
44
-
45
-
46
-
47
-
48
-
49
-
50
-
51
-
52
-
53
-
54
-
55
-
56
-
57
-
58
-
59
-
60
-
61
-
62
-
63
-
64
-
65
-
66
-
67
-
68
-
69
-
70
-
71
-
72
-
73
-
74
-
75
-
76
-
77
-
78
-
79
-
80
-
81
-
82
-
83
-
84
-
85
-
86
-
87
-
88
-
89
-
90
-
91
-
92
-
93
-
94
-
95
-
96
-
97
-
98
-
99
-
100
-
101
-
102
-
103
-
104
-
105
-
106
-
107
-
108
-
109
-
110
-
111
-
112
-
113
-
114
-
115
-
116
-
117
-
118
-
119
-
120
-
121
-
122
-
123
-
124
-
125
-
126
-
127
-
128
-
129
-
130
-
131
-
132
-
133
-
134
-
135
-
136
-
137
-
138
-
139
-
140
-
141
-
142
-
143
-
144
-
145
-
146
-
147
-
148
-
149
-
150
-
151
-
152
-
153
-
154
-
155
-
156
-
157
-
158
-
159
-
160
-
161
-
162
-
163
-
164
-
165
-
166
-
167
-
168
-
169
-
170
-
171
-
172
-
173
-
174
-
175
-
176
-
177
-
178
-
179
-
180
-
181
-
182
-
183
-
184
-
185
-
186
-
187
-
188
-
189
-
 190
190 -
 191
191 -
 192
192 -
 193
193 -
 194
194 -
 195
195 -
 196
196 -
 197
197 -
 198
198 -
 199
199 -
 200
200 -
 201
201 -
 202
202 -
 203
203 -
 204
204 -
 205
205 -
 206
206 -
 207
207 -
 208
208 -
 209
209 -
 210
210 -
211
-
212
-
213
-
214
-
215
-
216
-
217
-
218
-
219
-
220
-
221
-
222
-
223
-
224
-
225
-
226
-
227
-
228
-
229
-
230
-
231
-
232
-
233
-
234
-
235
-
236
-
237
-
238
-
239
-
240
-
241
-
242
-
243
-
244
-
245
-
246
-
247
-
248
-
249
-
250
-
251
-
252
-
253
-
254
-
255
-
256
-
257
-
258
-
259
-
260
-
261
-
262
-
263
-
264
-
265
-
266
-
267
-
268
-
269
-
270
-
271
-
272
-
273
-
274
-
275
-
276
-
277
-
278
-
279
-
280
-
281
-
282
-
283
-
284
-
285
-
286
-
287
-
288
-
289
-
290
-
291
-
292
-
293
-
294
-
295
-
296
-
297
-
298
-
299
-
300
-
301
-
302
-
303
-
304
-
305
-
306
-
307
-
308
-
309
-
310
-
311
-
312
-
313
-
314
-
315
-
316
-
317
-
318
-
319
-
320
-
321
-
322
-
323
-
324
-
325
-
326
-
327
-
328
-
329
-
330
-
331
-
332
-
333
-
334
-
335
-
336
-
337
-
338
-
339
-
340
-
341
-
342
-
343
-
344
-
345
-
346
-
347
-
348
-
349
-
350
-
351
-
352
-
353
-
354
-
355
-
356
-
357
-
358
-
359
-
360
-
361
-
362
-
363
-
364
-
365
-
366
-
367
-
368
-
369
-
370
-
371
-
372
-
373
-
374
 |
 |

199
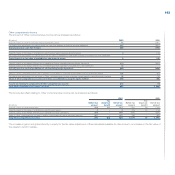
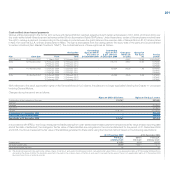
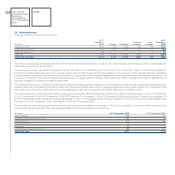
The following table summarises outstanding stock options under the CNH EIP:
At 31 December 2009 At 31 December 2008
Weighted Average
Number remaining Average Number Average
of options Contractual Exercise Price of options Exercise Price
Exercise Price (in USD) Outstanding life (in years) (in USD) Outstanding (in USD)
13.58 – 19.99 2,243,243 5.0 13.70 111,688 16.18
20.00 – 29.99 186,760 2.2 21.20 225,908 21.20
30.00 – 39.99 1,256,178 2.9 37.21 1,518,935 37.23
40.00 – 68.85 646,654 3.3 52.80 861,578 55.47
Total 4,332,835 2,718,109
Changes during the period in all CNH stock option plans are as follows:
2009 2008
Average Average
Number exercise price Number exercise price
of shares (in USD) of shares (in USD)
Outstanding at the beginning of the year 2,718,109 40.82 2,471,238 38.08
Granted 4,144,800 13.58 1,299,474 48.75
Forfeited (2,404,528) 18.06 (913,064) 46.70
Exercised (8,136) 18.65 (139,539) 27.71
Expired (117,410) 68.85 - -
Outstanding at the end of the year 4,332,835 26.67 2,718,109 40.82
Exercisable at the end of the year 1,488,840 37.81 1,142,411 40.74
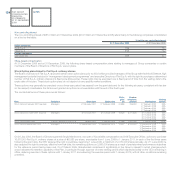
Performance Share Grants
Under the CNH EIP, performance-based shares may also be granted to selected key employees and executive officers. CNH establishes the period and
conditions of performance for each award and holds the shares during the performance period. Performance-based shares vest upon the attainment of
specified performance objectives.
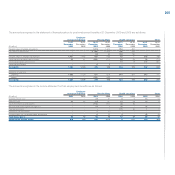
The following table reflects performance-based share activity under the CNH EIP:
2009 2008
Weighted Weighted
average average
grant date grant date
Number fair value Number fair value
of shares (in USD) of shares (in USD)
Non-vested at the beginning of the year 1,870,500 31.28 2,011,790 30.82
Granted 25,000 11.83 100,000 26.76
Forfeited (546,500) 30.52 (155,000) 28.09
Vested - - (86,290) 21.22
Non-vested at the end of the year 1,349,000 31.22 1,870,500 31.28
In connection with the new performance-based plans which were approved in 2006, CNH introduced the Top Performance Plan (“TPP”), under which CNH
has granted performance based, non-vested share awards to approximately 200 of the Sector’s top executives. The TPP performance shares vest only if
specified targets are achieved in 2009, or 2010.