Chrysler 2009 Annual Report Download - page 176
Download and view the complete annual report
Please find page 176 of the 2009 Chrysler annual report below. You can navigate through the pages in the report by either clicking on the pages listed below, or by using the keyword search tool below to find specific information within the annual report.-
 1
1 -
2
-
3
-
4
-
5
-
6
-
7
-
8
-
9
-
10
-
11
-
12
-
13
-
14
-
15
-
16
-
17
-
18
-
19
-
20
-
21
-
22
-
23
-
24
-
25
-
26
-
27
-
28
-
29
-
30
-
31
-
32
-
33
-
34
-
35
-
36
-
37
-
38
-
39
-
40
-
41
-
42
-
43
-
44
-
45
-
46
-
47
-
48
-
49
-
50
-
51
-
52
-
53
-
54
-
55
-
56
-
57
-
58
-
59
-
60
-
61
-
62
-
63
-
64
-
65
-
66
-
67
-
68
-
69
-
70
-
71
-
72
-
73
-
74
-
75
-
76
-
77
-
78
-
79
-
80
-
81
-
82
-
83
-
84
-
85
-
86
-
87
-
88
-
89
-
90
-
91
-
92
-
93
-
94
-
95
-
96
-
97
-
98
-
99
-
100
-
101
-
102
-
103
-
104
-
105
-
106
-
107
-
108
-
109
-
110
-
111
-
112
-
113
-
114
-
115
-
116
-
117
-
118
-
119
-
120
-
121
-
122
-
123
-
124
-
125
-
126
-
127
-
128
-
129
-
130
-
131
-
132
-
133
-
134
-
135
-
136
-
137
-
138
-
139
-
140
-
141
-
142
-
143
-
144
-
145
-
146
-
147
-
148
-
149
-
150
-
151
-
152
-
153
-
154
-
155
-
156
-
157
-
158
-
159
-
160
-
161
-
162
-
163
-
164
-
165
-
 166
166 -
 167
167 -
 168
168 -
 169
169 -
 170
170 -
 171
171 -
 172
172 -
 173
173 -
 174
174 -
 175
175 -
 176
176 -
 177
177 -
 178
178 -
 179
179 -
 180
180 -
 181
181 -
 182
182 -
 183
183 -
 184
184 -
 185
185 -
 186
186 -
187
-
188
-
189
-
190
-
191
-
192
-
193
-
194
-
195
-
196
-
197
-
198
-
199
-
200
-
201
-
202
-
203
-
204
-
205
-
206
-
207
-
208
-
209
-
210
-
211
-
212
-
213
-
214
-
215
-
216
-
217
-
218
-
219
-
220
-
221
-
222
-
223
-
224
-
225
-
226
-
227
-
228
-
229
-
230
-
231
-
232
-
233
-
234
-
235
-
236
-
237
-
238
-
239
-
240
-
241
-
242
-
243
-
244
-
245
-
246
-
247
-
248
-
249
-
250
-
251
-
252
-
253
-
254
-
255
-
256
-
257
-
258
-
259
-
260
-
261
-
262
-
263
-
264
-
265
-
266
-
267
-
268
-
269
-
270
-
271
-
272
-
273
-
274
-
275
-
276
-
277
-
278
-
279
-
280
-
281
-
282
-
283
-
284
-
285
-
286
-
287
-
288
-
289
-
290
-
291
-
292
-
293
-
294
-
295
-
296
-
297
-
298
-
299
-
300
-
301
-
302
-
303
-
304
-
305
-
306
-
307
-
308
-
309
-
310
-
311
-
312
-
313
-
314
-
315
-
316
-
317
-
318
-
319
-
320
-
321
-
322
-
323
-
324
-
325
-
326
-
327
-
328
-
329
-
330
-
331
-
332
-
333
-
334
-
335
-
336
-
337
-
338
-
339
-
340
-
341
-
342
-
343
-
344
-
345
-
346
-
347
-
348
-
349
-
350
-
351
-
352
-
353
-
354
-
355
-
356
-
357
-
358
-
359
-
360
-
361
-
362
-
363
-
364
-
365
-
366
-
367
-
368
-
369
-
370
-
371
-
372
-
373
-
374
 |
 |

175
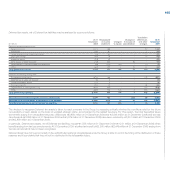
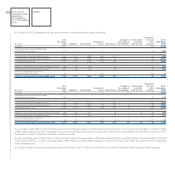
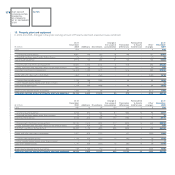
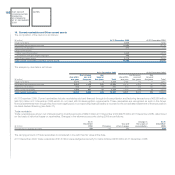
In 2009 and 2008, Changes in accumulated depreciation and impairment losses were as follows
Reclassified
At 31 Change in to Assets At 31
December Impairment the scope of Translation held Other December
(€ million) 2008 Depreciation losses Divestitures consolidation differences for sale changes 2009
Land 6 - - - - 1 - 2 9
Owned industrial buildings 2,326 155 21 (22) (5) 75 - 11 2,561
Industrial buildings leased under finance leases 18 3 - (1) - - - (3) 17
Total Industrial buildings 2,344 158 21 (23) (5) 75 - 8 2,578
Owned plant, machinery and equipment 19,565 1,443 126 (645) (10) 462 - (128) 20,813
Plant, machinery and equipment leased under finance leases 83 42 - (1) (2) - - (2) 120
Total Plant, machinery and equipment 19,648 1,485 126 (646) (12) 462 - (130) 20,933
Assets sold with a buy-back commitment 300 135 32 (81) - 4 - (82) 308
Owned other tangible assets 1,271 125 8 (79) (3) 27 - (10) 1,339
Other tangible assets leased under finance leases 4 1 - - - - - - 5
Total Other tangible assets 1,275 126 8 (79) (3) 27 - (10) 1,344
Advances and tangible assets in progress 14 - 19 (2) - - - (15) 16
Total accumulated depreciation and impairment
of Property, plant and equipment 23,587 1,904 206 (831) (20) 569 - (227) 25,188
Reclassified
At 31 Change in to Assets At 31
December Impairment the scope of Translation held Other December
(€ million) 2007 Depreciation losses Divestitures consolidation differences for sale changes 2008
Land 6 - - - - - - - 6
Owned industrial buildings 2,244 147 8 (15) 28 (86) 2 (2) 2,326
Industrial buildings leased under finance leases 13 3 - (1) 1 - - 2 18
Total Industrial buildings 2,257 150 8 (16) 29 (86) 2 - 2,344
Owned plant, machinery and equipment 19,202 1,559 27 (798) 135 (559) 4 (5) 19,565
Plant, machinery and equipment leased under finance leases 15 49 - (3) 22 - - - 83
Total Plant, machinery and equipment 19,217 1,608 27 (801) 157 (559) 4 (5) 19,648
Assets sold with a buy-back commitment 311 143 12 (71) - (16) - (79) 300
Owned other tangible assets 1,316 120 1 (133) 6 (29) 9 (19) 1,271
Other tangible assets leased under finance leases 4 1 - - - - - (1) 4
Total Other tangible assets 1,320 121 1 (133) 6 (29) 9 (20) 1,275
Advances and tangible assets in progress 12 - 2 - - - - - 14
Total accumulated depreciation and impairment
of Property, plant and equipment 23,123 2,022 50 (1,021) 192 (690) 15 (104) 23,587