Chrysler 2009 Annual Report Download - page 161
Download and view the complete annual report
Please find page 161 of the 2009 Chrysler annual report below. You can navigate through the pages in the report by either clicking on the pages listed below, or by using the keyword search tool below to find specific information within the annual report.-
 1
1 -
2
-
3
-
4
-
5
-
6
-
7
-
8
-
9
-
10
-
11
-
12
-
13
-
14
-
15
-
16
-
17
-
18
-
19
-
20
-
21
-
22
-
23
-
24
-
25
-
26
-
27
-
28
-
29
-
30
-
31
-
32
-
33
-
34
-
35
-
36
-
37
-
38
-
39
-
40
-
41
-
42
-
43
-
44
-
45
-
46
-
47
-
48
-
49
-
50
-
51
-
52
-
53
-
54
-
55
-
56
-
57
-
58
-
59
-
60
-
61
-
62
-
63
-
64
-
65
-
66
-
67
-
68
-
69
-
70
-
71
-
72
-
73
-
74
-
75
-
76
-
77
-
78
-
79
-
80
-
81
-
82
-
83
-
84
-
85
-
86
-
87
-
88
-
89
-
90
-
91
-
92
-
93
-
94
-
95
-
96
-
97
-
98
-
99
-
100
-
101
-
102
-
103
-
104
-
105
-
106
-
107
-
108
-
109
-
110
-
111
-
112
-
113
-
114
-
115
-
116
-
117
-
118
-
119
-
120
-
121
-
122
-
123
-
124
-
125
-
126
-
127
-
128
-
129
-
130
-
131
-
132
-
133
-
134
-
135
-
136
-
137
-
138
-
139
-
140
-
141
-
142
-
143
-
144
-
145
-
146
-
147
-
148
-
149
-
150
-
 151
151 -
 152
152 -
 153
153 -
 154
154 -
 155
155 -
 156
156 -
 157
157 -
 158
158 -
 159
159 -
 160
160 -
 161
161 -
 162
162 -
 163
163 -
 164
164 -
 165
165 -
 166
166 -
 167
167 -
 168
168 -
 169
169 -
 170
170 -
 171
171 -
172
-
173
-
174
-
175
-
176
-
177
-
178
-
179
-
180
-
181
-
182
-
183
-
184
-
185
-
186
-
187
-
188
-
189
-
190
-
191
-
192
-
193
-
194
-
195
-
196
-
197
-
198
-
199
-
200
-
201
-
202
-
203
-
204
-
205
-
206
-
207
-
208
-
209
-
210
-
211
-
212
-
213
-
214
-
215
-
216
-
217
-
218
-
219
-
220
-
221
-
222
-
223
-
224
-
225
-
226
-
227
-
228
-
229
-
230
-
231
-
232
-
233
-
234
-
235
-
236
-
237
-
238
-
239
-
240
-
241
-
242
-
243
-
244
-
245
-
246
-
247
-
248
-
249
-
250
-
251
-
252
-
253
-
254
-
255
-
256
-
257
-
258
-
259
-
260
-
261
-
262
-
263
-
264
-
265
-
266
-
267
-
268
-
269
-
270
-
271
-
272
-
273
-
274
-
275
-
276
-
277
-
278
-
279
-
280
-
281
-
282
-
283
-
284
-
285
-
286
-
287
-
288
-
289
-
290
-
291
-
292
-
293
-
294
-
295
-
296
-
297
-
298
-
299
-
300
-
301
-
302
-
303
-
304
-
305
-
306
-
307
-
308
-
309
-
310
-
311
-
312
-
313
-
314
-
315
-
316
-
317
-
318
-
319
-
320
-
321
-
322
-
323
-
324
-
325
-
326
-
327
-
328
-
329
-
330
-
331
-
332
-
333
-
334
-
335
-
336
-
337
-
338
-
339
-
340
-
341
-
342
-
343
-
344
-
345
-
346
-
347
-
348
-
349
-
350
-
351
-
352
-
353
-
354
-
355
-
356
-
357
-
358
-
359
-
360
-
361
-
362
-
363
-
364
-
365
-
366
-
367
-
368
-
369
-
370
-
371
-
372
-
373
-
374
 |
 |

160 FIAT GROUP
CONSOLIDATED
FINANCIAL
STATEMENTS
AT 31 DECEMBER
2009
NOTES
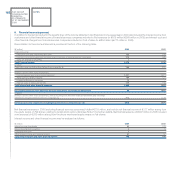
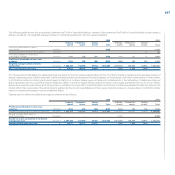
COMPOSITION AND PRINCIPAL CHANGES
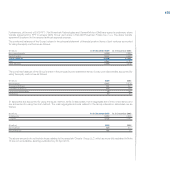
Net revenues1.
Net revenues can be analysed as follows:
(€ million) 2009 2008
Sales of goods 45,973 54,687
Rendering of services 2,496 2,525
Interest income from customers and other financial income of financial services companies 918 959
Contract revenues 258 732
Rents on assets sold with a buy-back commitment 271 305
Rents on operating leases 167 154
Other 19 202
Total Net revenues 50,102 59,564
Cost of sales2.
Cost of sales comprises the following:
(€ million) 2009 2008
Interest cost and other financial expenses from financial services companies 804 777
Other cost of sales 42,457 48,835
Total Cost of sales 43,261 49,612
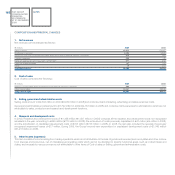
Selling, general and administrative costs3.
Selling costs amount to€2,504 million in 2009 (€2,939 million in 2008) and comprise mainly marketing, advertising and sales personnel costs.
General and administrative costs amount to€1,792 million in 2009 (€2,136 million in 2008) and comprise mainly expenses for administration which are not
attributable to sales, production and research and development functions.
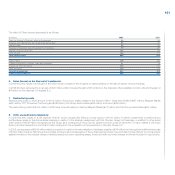
Research and development costs4.
In 2009, Research and development costs of€1,398 million (€1,497 million in 2008) comprise all the research and development costs not recognised
as assets in the year, amounting to€646 million (€770 million in 2008), the write-down of costs previously capitalised of€47 million (€9 million in 2008),
and the amortisation of capitalised development costs of€705 million (€735 million in 2008). In 2008, the item also included the reversal of previously
recognised impairment losses of€17 million. During 2009, the Group incurred new expenditure for capitalised development costs of€1,046 million
(€1,216 million in 2008).
Other income (expenses)5.
This item consists of income arising from trading operations which is not attributable to the sale of goods and services (such as royalties and other income
from licences and know-how), net of miscellaneous operating costs which cannot be allocated to specific functional areas, such as indirect taxes and
duties, and accruals for various provisions not attributable to other items of Cost of sales or Selling, general and administrative costs.