Chrysler 2009 Annual Report Download - page 118
Download and view the complete annual report
Please find page 118 of the 2009 Chrysler annual report below. You can navigate through the pages in the report by either clicking on the pages listed below, or by using the keyword search tool below to find specific information within the annual report.-
 1
1 -
2
-
3
-
4
-
5
-
6
-
7
-
8
-
9
-
10
-
11
-
12
-
13
-
14
-
15
-
16
-
17
-
18
-
19
-
20
-
21
-
22
-
23
-
24
-
25
-
26
-
27
-
28
-
29
-
30
-
31
-
32
-
33
-
34
-
35
-
36
-
37
-
38
-
39
-
40
-
41
-
42
-
43
-
44
-
45
-
46
-
47
-
48
-
49
-
50
-
51
-
52
-
53
-
54
-
55
-
56
-
57
-
58
-
59
-
60
-
61
-
62
-
63
-
64
-
65
-
66
-
67
-
68
-
69
-
70
-
71
-
72
-
73
-
74
-
75
-
76
-
77
-
78
-
79
-
80
-
81
-
82
-
83
-
84
-
85
-
86
-
87
-
88
-
89
-
90
-
91
-
92
-
93
-
94
-
95
-
96
-
97
-
98
-
99
-
100
-
101
-
102
-
103
-
104
-
105
-
106
-
107
-
 108
108 -
 109
109 -
 110
110 -
 111
111 -
 112
112 -
 113
113 -
 114
114 -
 115
115 -
 116
116 -
 117
117 -
 118
118 -
 119
119 -
 120
120 -
 121
121 -
 122
122 -
 123
123 -
 124
124 -
 125
125 -
 126
126 -
 127
127 -
 128
128 -
129
-
130
-
131
-
132
-
133
-
134
-
135
-
136
-
137
-
138
-
139
-
140
-
141
-
142
-
143
-
144
-
145
-
146
-
147
-
148
-
149
-
150
-
151
-
152
-
153
-
154
-
155
-
156
-
157
-
158
-
159
-
160
-
161
-
162
-
163
-
164
-
165
-
166
-
167
-
168
-
169
-
170
-
171
-
172
-
173
-
174
-
175
-
176
-
177
-
178
-
179
-
180
-
181
-
182
-
183
-
184
-
185
-
186
-
187
-
188
-
189
-
190
-
191
-
192
-
193
-
194
-
195
-
196
-
197
-
198
-
199
-
200
-
201
-
202
-
203
-
204
-
205
-
206
-
207
-
208
-
209
-
210
-
211
-
212
-
213
-
214
-
215
-
216
-
217
-
218
-
219
-
220
-
221
-
222
-
223
-
224
-
225
-
226
-
227
-
228
-
229
-
230
-
231
-
232
-
233
-
234
-
235
-
236
-
237
-
238
-
239
-
240
-
241
-
242
-
243
-
244
-
245
-
246
-
247
-
248
-
249
-
250
-
251
-
252
-
253
-
254
-
255
-
256
-
257
-
258
-
259
-
260
-
261
-
262
-
263
-
264
-
265
-
266
-
267
-
268
-
269
-
270
-
271
-
272
-
273
-
274
-
275
-
276
-
277
-
278
-
279
-
280
-
281
-
282
-
283
-
284
-
285
-
286
-
287
-
288
-
289
-
290
-
291
-
292
-
293
-
294
-
295
-
296
-
297
-
298
-
299
-
300
-
301
-
302
-
303
-
304
-
305
-
306
-
307
-
308
-
309
-
310
-
311
-
312
-
313
-
314
-
315
-
316
-
317
-
318
-
319
-
320
-
321
-
322
-
323
-
324
-
325
-
326
-
327
-
328
-
329
-
330
-
331
-
332
-
333
-
334
-
335
-
336
-
337
-
338
-
339
-
340
-
341
-
342
-
343
-
344
-
345
-
346
-
347
-
348
-
349
-
350
-
351
-
352
-
353
-
354
-
355
-
356
-
357
-
358
-
359
-
360
-
361
-
362
-
363
-
364
-
365
-
366
-
367
-
368
-
369
-
370
-
371
-
372
-
373
-
374
 |
 |

117
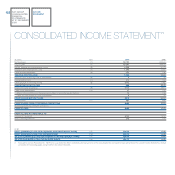
Personnel and operating costs, net of other income totalled €42 million, compared with €81 million for 2008.
Specifically:
Personnel and operating costs of €117 million consisted of €31 million in personnel costs (€37 million for 2008) and €86 million in other operating
costs (€114 million for 2008), which include services, amortisation/depreciation charges and other operating costs. The €34 million decrease over the
prior year was attributable to a reduction in costs for services rendered by third parties and Group companies, in addition to lower non-cash expenses
related to stock options. In 2009, the Company had an average of 152 employees (151 for 2008).
Other income of €75 million (€70 million for 2008) related principally to services rendered, including by senior managers, to other Group companies,
and changes in contract work in progress (contracts between Fiat S.p.A. and Treno Alta Velocità – T.A.V. S.p.A.), which are calculated on a percentage
completion basis. Compared with the prior year, there was an increase in amounts charged to Group companies for services, recovery of costs and
seconded of management personnel, which compensated for the discontinuation in royalties from the FIAT trademark.
For 2009, there were no gains from non-recurring transactions, while in 2008 there was a net gain of €879 million from the sale of the Fiat
trademark to the subsidiary Fiat Group Marketing & Corporate Communication S.p.A., which is responsible for brand management.
Net financial expense was €14 million and included €131 million in net financial charges, primarily for interest on financial debt, which was largely
offset by a €117 million gain on the mark-to-market value of two stock-option related equity swaps on Fiat S.p.A. shares. For 2008, there was net financial
expense of €422 million, of which €159 million primarily related to interest on financial debt, in addition to a €263 million loss on the mark-to-market value
of those equity swaps.
Income taxes totalled €6 million and essentially consisted of IRAP (Italian regional income tax) amounts paid in relation to taxable income for the prior
year, net of the release of deferred tax provisions. For 2008, income taxes totalled €44 million and consisted of current and deferred IRAP, in addition to
adjustments related to the domestic tax consolidation for the previous year.
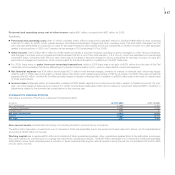
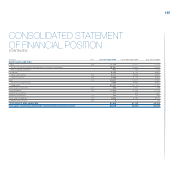
STATEMENT OF FINANCIAL POSITION
Following is a summary of Fiat S.p.A.’s statement of financial position:
(E million) At 31.12.2009 At 31.12.2008
Non-current assets 14,049 14,499
of which: Investments 13,991 14,445
Working capital (235) 34
NET CAPITAL INVESTED 13,814 14,533
EQUITY 12,487 12,170
NET DEBT 1,327 2,363
Non-current assets consisted almost entirely of controlling interests in principal Group companies.
The €454 million decrease in investments over 31 December 2008 was essentially due to the impairment losses referred to above, net of recapitalisations
amounting to €406 million for the year.
Working capital was a negative €235 million and consisted of trade receivables/payables, other receivables/payables (from/to tax authorities, employees,
etc.), and inventory for contract work in progress net of advances, as well as provisions. The €269 million decrease over 31 December 2008 was essentially
attributable to lower trade receivables and a reduction in taxes receivable following tax refunds received during the year (for consolidated VAT and for IRES
on prior years’ income).