Chrysler 2009 Annual Report Download - page 322
Download and view the complete annual report
Please find page 322 of the 2009 Chrysler annual report below. You can navigate through the pages in the report by either clicking on the pages listed below, or by using the keyword search tool below to find specific information within the annual report.-
 1
1 -
2
-
3
-
4
-
5
-
6
-
7
-
8
-
9
-
10
-
11
-
12
-
13
-
14
-
15
-
16
-
17
-
18
-
19
-
20
-
21
-
22
-
23
-
24
-
25
-
26
-
27
-
28
-
29
-
30
-
31
-
32
-
33
-
34
-
35
-
36
-
37
-
38
-
39
-
40
-
41
-
42
-
43
-
44
-
45
-
46
-
47
-
48
-
49
-
50
-
51
-
52
-
53
-
54
-
55
-
56
-
57
-
58
-
59
-
60
-
61
-
62
-
63
-
64
-
65
-
66
-
67
-
68
-
69
-
70
-
71
-
72
-
73
-
74
-
75
-
76
-
77
-
78
-
79
-
80
-
81
-
82
-
83
-
84
-
85
-
86
-
87
-
88
-
89
-
90
-
91
-
92
-
93
-
94
-
95
-
96
-
97
-
98
-
99
-
100
-
101
-
102
-
103
-
104
-
105
-
106
-
107
-
108
-
109
-
110
-
111
-
112
-
113
-
114
-
115
-
116
-
117
-
118
-
119
-
120
-
121
-
122
-
123
-
124
-
125
-
126
-
127
-
128
-
129
-
130
-
131
-
132
-
133
-
134
-
135
-
136
-
137
-
138
-
139
-
140
-
141
-
142
-
143
-
144
-
145
-
146
-
147
-
148
-
149
-
150
-
151
-
152
-
153
-
154
-
155
-
156
-
157
-
158
-
159
-
160
-
161
-
162
-
163
-
164
-
165
-
166
-
167
-
168
-
169
-
170
-
171
-
172
-
173
-
174
-
175
-
176
-
177
-
178
-
179
-
180
-
181
-
182
-
183
-
184
-
185
-
186
-
187
-
188
-
189
-
190
-
191
-
192
-
193
-
194
-
195
-
196
-
197
-
198
-
199
-
200
-
201
-
202
-
203
-
204
-
205
-
206
-
207
-
208
-
209
-
210
-
211
-
212
-
213
-
214
-
215
-
216
-
217
-
218
-
219
-
220
-
221
-
222
-
223
-
224
-
225
-
226
-
227
-
228
-
229
-
230
-
231
-
232
-
233
-
234
-
235
-
236
-
237
-
238
-
239
-
240
-
241
-
242
-
243
-
244
-
245
-
246
-
247
-
248
-
249
-
250
-
251
-
252
-
253
-
254
-
255
-
256
-
257
-
258
-
259
-
260
-
261
-
262
-
263
-
264
-
265
-
266
-
267
-
268
-
269
-
270
-
271
-
272
-
273
-
274
-
275
-
276
-
277
-
278
-
279
-
280
-
281
-
282
-
283
-
284
-
285
-
286
-
287
-
288
-
289
-
290
-
291
-
292
-
293
-
294
-
295
-
296
-
297
-
298
-
299
-
300
-
301
-
302
-
303
-
304
-
305
-
306
-
307
-
308
-
309
-
310
-
311
-
 312
312 -
 313
313 -
 314
314 -
 315
315 -
 316
316 -
 317
317 -
 318
318 -
 319
319 -
 320
320 -
 321
321 -
 322
322 -
 323
323 -
 324
324 -
 325
325 -
 326
326 -
 327
327 -
 328
328 -
 329
329 -
 330
330 -
 331
331 -
 332
332 -
333
-
334
-
335
-
336
-
337
-
338
-
339
-
340
-
341
-
342
-
343
-
344
-
345
-
346
-
347
-
348
-
349
-
350
-
351
-
352
-
353
-
354
-
355
-
356
-
357
-
358
-
359
-
360
-
361
-
362
-
363
-
364
-
365
-
366
-
367
-
368
-
369
-
370
-
371
-
372
-
373
-
374
 |
 |

321
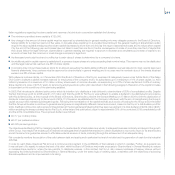
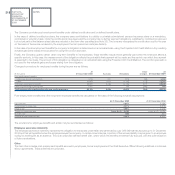
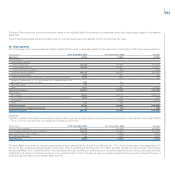
The fair value of these loans at 31 December 2009 was €1.9 billion and was calculated using market rates of interest appropriately adjusted to reflect the
credit spreads applicable to Fiat at the balance sheet date.
The item financial guarantee contracts consisted of the fair value of the liabilities assumed from guarantees issued. After assessing the potential risks in
relation to which contingent liabilities must be recognised and given that this item relates essentially to guarantees provided on behalf of loans to Group
companies, it has been concluded that the present value of fees receivable for guarantees given (see other financial assets in Note 13) represented the best
estimate of the fair value of these guarantees.
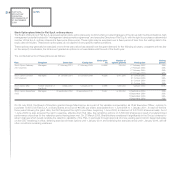
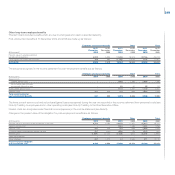
The breakdown by maturity date is as follows:
(€ thousand)
At 31 December 2009 At 31 December 2008
Financial guarantee contracts
due within one year 5,344 3,418
due after one year but within five years 11,145 6,617
due beyond five years 293 496
Total 16,782 10,531
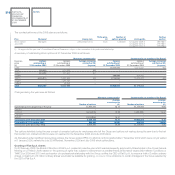
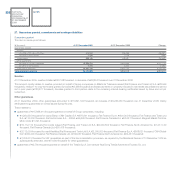
22. Other non-current liabilities
At 31 December 2009, other non-current liabilities amounted to €14,351 thousand, showing a net decrease of €764 thousand over the previous year end.
The item consisted of the following:
(€ thousand) At 31 December 2009 At 31 December 2008 Change
Non-current post-employment benefits to be paid:
to a former Chief Executive Officer 4,690 4,984 (294)
to former employees 9,661 10,131 (470)
Total other non-current liabilities 14,351 15,115 (764)
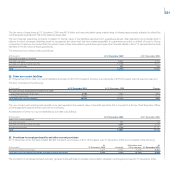
The non-current post-employment benefits to be paid represent the present value of benefits (see Note 20) to be paid to a former Chief Executive Officer
and management personnel that have left the Company.
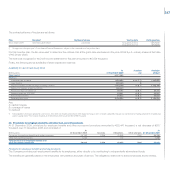
A breakdown of other non-current liabilities by due date is as follows:
(€ thousand)
At 31 December 2009 At 31 December 2008
Other non-current liabilities
due within one year 791 764
due after one year but within five years 4,394 4,244
due beyond five years 9,166 10,107
Total 14,351 15,115
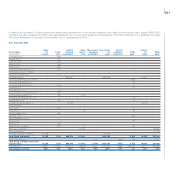
23. Provisions for employee benefits and other current provisions
At 31 December 2009, this item totalled €8,464 thousand, an increase of €2,118 thousand over 31 December 2008, and consisted of the following:
At Utilisations and At
(€ thousand) 31 December 2008 Accruals Other changes 31 December 2009
Provision for employee bonuses 6,346 8,254 (6,136) 8,464
Total provisions for employee benefits and other current provisions 6,346 8,254 (6,136) 8,464
The provision for employee bonuses primarily represents the estimate of variable compensation payable to employees accrued at 31 December 2009.