Chrysler 2009 Annual Report Download - page 189
Download and view the complete annual report
Please find page 189 of the 2009 Chrysler annual report below. You can navigate through the pages in the report by either clicking on the pages listed below, or by using the keyword search tool below to find specific information within the annual report.-
 1
1 -
2
-
3
-
4
-
5
-
6
-
7
-
8
-
9
-
10
-
11
-
12
-
13
-
14
-
15
-
16
-
17
-
18
-
19
-
20
-
21
-
22
-
23
-
24
-
25
-
26
-
27
-
28
-
29
-
30
-
31
-
32
-
33
-
34
-
35
-
36
-
37
-
38
-
39
-
40
-
41
-
42
-
43
-
44
-
45
-
46
-
47
-
48
-
49
-
50
-
51
-
52
-
53
-
54
-
55
-
56
-
57
-
58
-
59
-
60
-
61
-
62
-
63
-
64
-
65
-
66
-
67
-
68
-
69
-
70
-
71
-
72
-
73
-
74
-
75
-
76
-
77
-
78
-
79
-
80
-
81
-
82
-
83
-
84
-
85
-
86
-
87
-
88
-
89
-
90
-
91
-
92
-
93
-
94
-
95
-
96
-
97
-
98
-
99
-
100
-
101
-
102
-
103
-
104
-
105
-
106
-
107
-
108
-
109
-
110
-
111
-
112
-
113
-
114
-
115
-
116
-
117
-
118
-
119
-
120
-
121
-
122
-
123
-
124
-
125
-
126
-
127
-
128
-
129
-
130
-
131
-
132
-
133
-
134
-
135
-
136
-
137
-
138
-
139
-
140
-
141
-
142
-
143
-
144
-
145
-
146
-
147
-
148
-
149
-
150
-
151
-
152
-
153
-
154
-
155
-
156
-
157
-
158
-
159
-
160
-
161
-
162
-
163
-
164
-
165
-
166
-
167
-
168
-
169
-
170
-
171
-
172
-
173
-
174
-
175
-
176
-
177
-
178
-
 179
179 -
 180
180 -
 181
181 -
 182
182 -
 183
183 -
 184
184 -
 185
185 -
 186
186 -
 187
187 -
 188
188 -
 189
189 -
 190
190 -
 191
191 -
 192
192 -
 193
193 -
 194
194 -
 195
195 -
 196
196 -
 197
197 -
 198
198 -
 199
199 -
200
-
201
-
202
-
203
-
204
-
205
-
206
-
207
-
208
-
209
-
210
-
211
-
212
-
213
-
214
-
215
-
216
-
217
-
218
-
219
-
220
-
221
-
222
-
223
-
224
-
225
-
226
-
227
-
228
-
229
-
230
-
231
-
232
-
233
-
234
-
235
-
236
-
237
-
238
-
239
-
240
-
241
-
242
-
243
-
244
-
245
-
246
-
247
-
248
-
249
-
250
-
251
-
252
-
253
-
254
-
255
-
256
-
257
-
258
-
259
-
260
-
261
-
262
-
263
-
264
-
265
-
266
-
267
-
268
-
269
-
270
-
271
-
272
-
273
-
274
-
275
-
276
-
277
-
278
-
279
-
280
-
281
-
282
-
283
-
284
-
285
-
286
-
287
-
288
-
289
-
290
-
291
-
292
-
293
-
294
-
295
-
296
-
297
-
298
-
299
-
300
-
301
-
302
-
303
-
304
-
305
-
306
-
307
-
308
-
309
-
310
-
311
-
312
-
313
-
314
-
315
-
316
-
317
-
318
-
319
-
320
-
321
-
322
-
323
-
324
-
325
-
326
-
327
-
328
-
329
-
330
-
331
-
332
-
333
-
334
-
335
-
336
-
337
-
338
-
339
-
340
-
341
-
342
-
343
-
344
-
345
-
346
-
347
-
348
-
349
-
350
-
351
-
352
-
353
-
354
-
355
-
356
-
357
-
358
-
359
-
360
-
361
-
362
-
363
-
364
-
365
-
366
-
367
-
368
-
369
-
370
-
371
-
372
-
373
-
374
 |
 |

188 FIAT GROUP
CONSOLIDATED
FINANCIAL
STATEMENTS
AT 31 DECEMBER
2009
NOTES
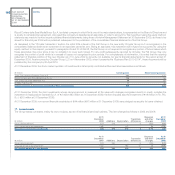
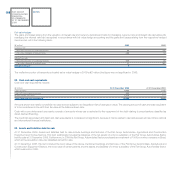
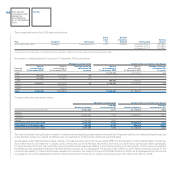
Fair value hedges
The gains and losses arising from the valuation of interest rate and currency derivatives (mostly for managing currency risk) and interest rate derivatives (for
managing the interest rate risk) recognised in accordance with fair value hedge accounting and the gains and losses arising from the respective hedged
items are set out in the following table:
(€ million) 2009 2008
Currency risk
Net gains (losses) on qualifying hedges 22 (34)
Fair value changes in hedged items (22) 34
Interest rate risk
Net gains (losses) on qualifying hedges (15) 80
Fair value changes in hedged items 17 (80)
Net gains (losses) 2 -
The ineffective portion of transactions treated as fair value hedges in 2009 is€2 million (the figure was not significant in 2008).
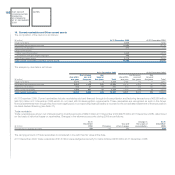
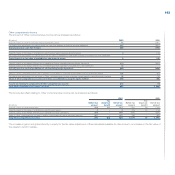
Cash and cash equivalents22.
Cash and cash equivalents include:
(€ million) At 31 December 2009 At 31 December 2008
Cash at banks 9,422 2,989
Cash with a pre-determined use 530 473
Money market securities 2,274 221
Total Cash and cash equivalents 12,226 3,683
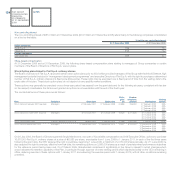
Amounts shown are readily convertible into cash and are subject to an insignificant risk of changes in value. The carrying amount of cash and cash equivalent
is to be considered in line with their fair value at the balance sheet date.
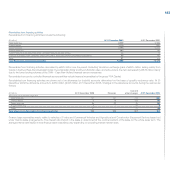
Cash with a pre-determined use mainly consists of amounts whose use is restricted to the repayment of the debt relating to securitisations classified as
Asset-backed financing.
The credit risk associated with Cash and cash equivalents is considered not significant, because it mainly relates to deposits spread across primary national
and international financial institutions.
Assets and Liabilities held for sale23.
At 31 December 2009, Assets and liabilities held for sale include buildings and factories of the Fiat Group Automobiles, Agricultural and Construction
Equipment and Comau Sectors. This item additionally includes the balances of the net assets of a minor subsidiary of the Fiat Group Automobiles Sector
held for sale at 31 December 2009. Furthermore, in 2009 the Fiat Group Automobiles Sector purchased an investment of 100% in a minor company in Brazil,
which at the acquisition date was classified as held for sale.
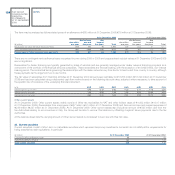
At 31 December 2008, this item included the book value of the above mentioned buildings and factories of the Fiat Group Automobiles, Agricultural and
Construction Equipment Sectors, the book value of certain patents and the assets and liabilities of a minor subsidiary of the Fiat Group Automobiles Sector
which was sold in 2009.