Chrysler 2009 Annual Report Download - page 42
Download and view the complete annual report
Please find page 42 of the 2009 Chrysler annual report below. You can navigate through the pages in the report by either clicking on the pages listed below, or by using the keyword search tool below to find specific information within the annual report.-
 1
1 -
2
-
3
-
4
-
5
-
6
-
7
-
8
-
9
-
10
-
11
-
12
-
13
-
14
-
15
-
16
-
17
-
18
-
19
-
20
-
21
-
22
-
23
-
24
-
25
-
26
-
27
-
28
-
29
-
30
-
31
-
 32
32 -
 33
33 -
 34
34 -
 35
35 -
 36
36 -
 37
37 -
 38
38 -
 39
39 -
 40
40 -
 41
41 -
 42
42 -
 43
43 -
 44
44 -
 45
45 -
 46
46 -
 47
47 -
 48
48 -
 49
49 -
 50
50 -
 51
51 -
 52
52 -
53
-
54
-
55
-
56
-
57
-
58
-
59
-
60
-
61
-
62
-
63
-
64
-
65
-
66
-
67
-
68
-
69
-
70
-
71
-
72
-
73
-
74
-
75
-
76
-
77
-
78
-
79
-
80
-
81
-
82
-
83
-
84
-
85
-
86
-
87
-
88
-
89
-
90
-
91
-
92
-
93
-
94
-
95
-
96
-
97
-
98
-
99
-
100
-
101
-
102
-
103
-
104
-
105
-
106
-
107
-
108
-
109
-
110
-
111
-
112
-
113
-
114
-
115
-
116
-
117
-
118
-
119
-
120
-
121
-
122
-
123
-
124
-
125
-
126
-
127
-
128
-
129
-
130
-
131
-
132
-
133
-
134
-
135
-
136
-
137
-
138
-
139
-
140
-
141
-
142
-
143
-
144
-
145
-
146
-
147
-
148
-
149
-
150
-
151
-
152
-
153
-
154
-
155
-
156
-
157
-
158
-
159
-
160
-
161
-
162
-
163
-
164
-
165
-
166
-
167
-
168
-
169
-
170
-
171
-
172
-
173
-
174
-
175
-
176
-
177
-
178
-
179
-
180
-
181
-
182
-
183
-
184
-
185
-
186
-
187
-
188
-
189
-
190
-
191
-
192
-
193
-
194
-
195
-
196
-
197
-
198
-
199
-
200
-
201
-
202
-
203
-
204
-
205
-
206
-
207
-
208
-
209
-
210
-
211
-
212
-
213
-
214
-
215
-
216
-
217
-
218
-
219
-
220
-
221
-
222
-
223
-
224
-
225
-
226
-
227
-
228
-
229
-
230
-
231
-
232
-
233
-
234
-
235
-
236
-
237
-
238
-
239
-
240
-
241
-
242
-
243
-
244
-
245
-
246
-
247
-
248
-
249
-
250
-
251
-
252
-
253
-
254
-
255
-
256
-
257
-
258
-
259
-
260
-
261
-
262
-
263
-
264
-
265
-
266
-
267
-
268
-
269
-
270
-
271
-
272
-
273
-
274
-
275
-
276
-
277
-
278
-
279
-
280
-
281
-
282
-
283
-
284
-
285
-
286
-
287
-
288
-
289
-
290
-
291
-
292
-
293
-
294
-
295
-
296
-
297
-
298
-
299
-
300
-
301
-
302
-
303
-
304
-
305
-
306
-
307
-
308
-
309
-
310
-
311
-
312
-
313
-
314
-
315
-
316
-
317
-
318
-
319
-
320
-
321
-
322
-
323
-
324
-
325
-
326
-
327
-
328
-
329
-
330
-
331
-
332
-
333
-
334
-
335
-
336
-
337
-
338
-
339
-
340
-
341
-
342
-
343
-
344
-
345
-
346
-
347
-
348
-
349
-
350
-
351
-
352
-
353
-
354
-
355
-
356
-
357
-
358
-
359
-
360
-
361
-
362
-
363
-
364
-
365
-
366
-
367
-
368
-
369
-
370
-
371
-
372
-
373
-
374
 |
 |

41
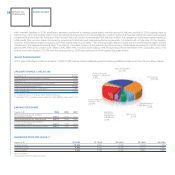
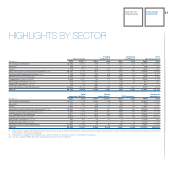
HIGHLIGHTS BY SECTOR
Trading Operating Total
Net revenues profit/(loss) profit/(loss) operating assets
(€ million) 2009 2008 (*) 2009 2008 2009 2008 2009 2008
Fiat Group Automobiles 26,293 26,937 470 691 217 460 16,157 15,958
Maserati 448 825 11 72 11 72 368 437
Ferrari 1,778 1,921 238 339 245 341 1,608 1,542
Agricultural and Construction Equipment (CNH) 10,107 12,781 337 1,122 251 1,146 18,346 19,958
Trucks and Commercial Vehicles (Iveco) 7,183 10,894 105 838 (90) 779 7,159 8,097
FPT Powertrain Technologies 4,952 7,000 (25) 166 (114) 162 4,988 4,953
Components (Magneti Marelli) 4,528 5,447 25 174 (40) 93 3,258 3,123
Metallurgical Products (Teksid) 578 837 (12) 41 (14) 49 517 497
Production Systems (Comau) 728 1,123 (28) 21 (32) - 567 751
Other Businesses and Eliminations (6,493) (8,201) (63) (102) (75) (130) (941) (575)
GROUP 50,102 59,564 1,058 3,362 359 2,972 52,027 54,741
Total Capital Number of
operating liabilities expenditure(1) R&D expense(2) employees
(€ million) 2009 2008 2009 2008 (*) 2009 2008 2009 2008
Fiat Group Automobiles 16,137 15,184 1,495 2,288 669 843 54,038 52,634
Maserati 511 657 65 73 33 47 723 767
Ferrari 1,843 1,726 290 311 156 164 2,835 3,017
Agricultural and Construction Equipment (CNH) 19,000 20,257 330 451 283 286 28,466 31,521
Trucks and Commercial Vehicles (Iveco) 7,021 7,948 217 367 169 246 24,917 27,108
FPT Powertrain Technologies 3,517 3,908 562 898 140 141 19,638 20,507
Components (Magneti Marelli) 2,658 2,675 356 474 245 268 31,628 33,216
Metallurgical Products (Teksid) 462 431 33 41 2 3 6,194 7,600
Production Systems (Comau) 499 667 13 17 10 13 11,708 11,445
Other Businesses and Eliminations (1,335) (2,006) 25 59 (15) (25) 9,867 10,533
GROUP 50,313 51,447 3,386 4,979 1,692 1,986 190,014 198,348
(*) Revenue and capital expenditure amounts shown for the Group as well as CNH and Iveco differ from those originally reported due to adoption in 2009 of the amendment to IAS 16, as described
in the notes to the financial statements.
(1) Investments in tangible and intangible assets (net of vehicles sold under buy-back commitments and leased).
(2) Includes capitalised R&D and R&D charged directly to the income statement.
REPORT ON
OPERATIONS
HIGHLIGHTS
BY SECTOR