Chrysler 2009 Annual Report Download - page 222
Download and view the complete annual report
Please find page 222 of the 2009 Chrysler annual report below. You can navigate through the pages in the report by either clicking on the pages listed below, or by using the keyword search tool below to find specific information within the annual report.-
 1
1 -
2
-
3
-
4
-
5
-
6
-
7
-
8
-
9
-
10
-
11
-
12
-
13
-
14
-
15
-
16
-
17
-
18
-
19
-
20
-
21
-
22
-
23
-
24
-
25
-
26
-
27
-
28
-
29
-
30
-
31
-
32
-
33
-
34
-
35
-
36
-
37
-
38
-
39
-
40
-
41
-
42
-
43
-
44
-
45
-
46
-
47
-
48
-
49
-
50
-
51
-
52
-
53
-
54
-
55
-
56
-
57
-
58
-
59
-
60
-
61
-
62
-
63
-
64
-
65
-
66
-
67
-
68
-
69
-
70
-
71
-
72
-
73
-
74
-
75
-
76
-
77
-
78
-
79
-
80
-
81
-
82
-
83
-
84
-
85
-
86
-
87
-
88
-
89
-
90
-
91
-
92
-
93
-
94
-
95
-
96
-
97
-
98
-
99
-
100
-
101
-
102
-
103
-
104
-
105
-
106
-
107
-
108
-
109
-
110
-
111
-
112
-
113
-
114
-
115
-
116
-
117
-
118
-
119
-
120
-
121
-
122
-
123
-
124
-
125
-
126
-
127
-
128
-
129
-
130
-
131
-
132
-
133
-
134
-
135
-
136
-
137
-
138
-
139
-
140
-
141
-
142
-
143
-
144
-
145
-
146
-
147
-
148
-
149
-
150
-
151
-
152
-
153
-
154
-
155
-
156
-
157
-
158
-
159
-
160
-
161
-
162
-
163
-
164
-
165
-
166
-
167
-
168
-
169
-
170
-
171
-
172
-
173
-
174
-
175
-
176
-
177
-
178
-
179
-
180
-
181
-
182
-
183
-
184
-
185
-
186
-
187
-
188
-
189
-
190
-
191
-
192
-
193
-
194
-
195
-
196
-
197
-
198
-
199
-
200
-
201
-
202
-
203
-
204
-
205
-
206
-
207
-
208
-
209
-
210
-
211
-
 212
212 -
 213
213 -
 214
214 -
 215
215 -
 216
216 -
 217
217 -
 218
218 -
 219
219 -
 220
220 -
 221
221 -
 222
222 -
 223
223 -
 224
224 -
 225
225 -
 226
226 -
 227
227 -
 228
228 -
 229
229 -
 230
230 -
 231
231 -
 232
232 -
233
-
234
-
235
-
236
-
237
-
238
-
239
-
240
-
241
-
242
-
243
-
244
-
245
-
246
-
247
-
248
-
249
-
250
-
251
-
252
-
253
-
254
-
255
-
256
-
257
-
258
-
259
-
260
-
261
-
262
-
263
-
264
-
265
-
266
-
267
-
268
-
269
-
270
-
271
-
272
-
273
-
274
-
275
-
276
-
277
-
278
-
279
-
280
-
281
-
282
-
283
-
284
-
285
-
286
-
287
-
288
-
289
-
290
-
291
-
292
-
293
-
294
-
295
-
296
-
297
-
298
-
299
-
300
-
301
-
302
-
303
-
304
-
305
-
306
-
307
-
308
-
309
-
310
-
311
-
312
-
313
-
314
-
315
-
316
-
317
-
318
-
319
-
320
-
321
-
322
-
323
-
324
-
325
-
326
-
327
-
328
-
329
-
330
-
331
-
332
-
333
-
334
-
335
-
336
-
337
-
338
-
339
-
340
-
341
-
342
-
343
-
344
-
345
-
346
-
347
-
348
-
349
-
350
-
351
-
352
-
353
-
354
-
355
-
356
-
357
-
358
-
359
-
360
-
361
-
362
-
363
-
364
-
365
-
366
-
367
-
368
-
369
-
370
-
371
-
372
-
373
-
374
 |
 |

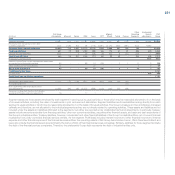
221
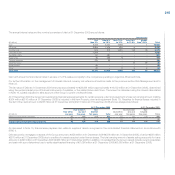
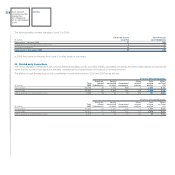
Other Unallocated
Fiat Group Magneti Operating items & FIAT
(€ million) Automobiles Maserati Ferrari CNH Iveco FPT Marelli Teksid Comau Segments adjustments Group
2008
Segment revenues 26,937 825 1,921 12,781 10,894 7,000 5,447 837 1,123 1,394 (9,595) 59,564
Revenues from transactions with other
operating segments (247) (109) (94) (9) (115) (5,491) (2,179) (300) (381) (670) 9,595 -
Revenues from external customers 26,690 716 1,827 12,772 10,779 1,509 3,268 537 742 724 - 59,564
Trading profit/(loss) 691 72 339 1,122 838 166 174 41 21 (65) (37) 3,362
Unusual income/(expense) (231) - 2 24 (59) (4) (81) 8 (21) (29) 1 (390)
Operating profit/(loss) 460 72 341 1,146 779 162 93 49 - (94) (36) 2,972
Financial income/(expense) (947) (947)
Interest in profit/(loss) of joint ventures and associates
accounted for by the equity method 94 - - 38 12 (28) - 2 1 11 3 133
Other profit/(loss) from investments (1) - - - 22 - - - - 4 4 29
Result from investments 93 - - 38 34 (28) - 2 1 15 7 162
Profit/(loss) before taxes 2,187
Income taxes 466 466
Profit/(loss) from continuing operations 1,721
Amortisation and depreciation (1,421) (73) (158) (297) (426) (344) (255) (26) (20)
Goodwill impairment - - - - - - - - (12)
Non-cash items other than depreciation
and amortisation (1,391) (64) (40) (2,251) (599) (113) (140) (22) (38)
Reversal of impairment losses on Intangible
assets and Property, plan and equipment 15 - - 17 1 - 1 - -
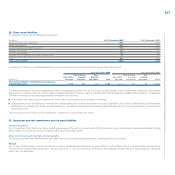
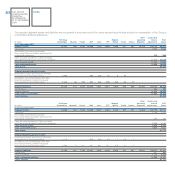
Segment assets are those assets employed by each segment in carrying out its usual activities or those which may be reasonably allocated to it on the basis
of its usual activities, including the value of investments in joint ventures and associates. Segment liabilities are those liabilities arising directly from each
segment’s usual activities or which may be reasonably allocated to it on the basis of its usual activities. The Group’s treasury and tax activities are managed
centrally and, therefore, are not allocated to the individual segments as they are not directly related to operating activities. These assets and liabilities are not
included under the assets and liabilities attributed to the segments, but rather are reported under Unallocated items and adjustments. In particular, treasury
assets include amounts receivable from financing activities, other non-current receivables, securities other financial assets, and cash and cash equivalents of
the Group’s industrial entities. Treasury liabilities, however, include debt and other financial liabilities of the Group’s industrial entities, net of current financial
receivables from jointly-controlled financial services entities. As the segment Profit/(loss) includes Interest income and other financial income and Interest
expense and other financial expense of the financial services entities, the operating assets of Fiat Group Automobiles, Ferrari, CNH-Case New Holland and
Iveco also include the financial assets (predominantly the loan portfolio) of their financial services companies. Similarly, liabilities for those segments include
the debt of the financial services companies. Therefore, the unallocated Group debt represents the debt of industrial entities only.