Chrysler 2009 Annual Report Download - page 63
Download and view the complete annual report
Please find page 63 of the 2009 Chrysler annual report below. You can navigate through the pages in the report by either clicking on the pages listed below, or by using the keyword search tool below to find specific information within the annual report.-
 1
1 -
2
-
3
-
4
-
5
-
6
-
7
-
8
-
9
-
10
-
11
-
12
-
13
-
14
-
15
-
16
-
17
-
18
-
19
-
20
-
21
-
22
-
23
-
24
-
25
-
26
-
27
-
28
-
29
-
30
-
31
-
32
-
33
-
34
-
35
-
36
-
37
-
38
-
39
-
40
-
41
-
42
-
43
-
44
-
45
-
46
-
47
-
48
-
49
-
50
-
51
-
52
-
 53
53 -
 54
54 -
 55
55 -
 56
56 -
 57
57 -
 58
58 -
 59
59 -
 60
60 -
 61
61 -
 62
62 -
 63
63 -
 64
64 -
 65
65 -
 66
66 -
 67
67 -
 68
68 -
 69
69 -
 70
70 -
 71
71 -
 72
72 -
 73
73 -
74
-
75
-
76
-
77
-
78
-
79
-
80
-
81
-
82
-
83
-
84
-
85
-
86
-
87
-
88
-
89
-
90
-
91
-
92
-
93
-
94
-
95
-
96
-
97
-
98
-
99
-
100
-
101
-
102
-
103
-
104
-
105
-
106
-
107
-
108
-
109
-
110
-
111
-
112
-
113
-
114
-
115
-
116
-
117
-
118
-
119
-
120
-
121
-
122
-
123
-
124
-
125
-
126
-
127
-
128
-
129
-
130
-
131
-
132
-
133
-
134
-
135
-
136
-
137
-
138
-
139
-
140
-
141
-
142
-
143
-
144
-
145
-
146
-
147
-
148
-
149
-
150
-
151
-
152
-
153
-
154
-
155
-
156
-
157
-
158
-
159
-
160
-
161
-
162
-
163
-
164
-
165
-
166
-
167
-
168
-
169
-
170
-
171
-
172
-
173
-
174
-
175
-
176
-
177
-
178
-
179
-
180
-
181
-
182
-
183
-
184
-
185
-
186
-
187
-
188
-
189
-
190
-
191
-
192
-
193
-
194
-
195
-
196
-
197
-
198
-
199
-
200
-
201
-
202
-
203
-
204
-
205
-
206
-
207
-
208
-
209
-
210
-
211
-
212
-
213
-
214
-
215
-
216
-
217
-
218
-
219
-
220
-
221
-
222
-
223
-
224
-
225
-
226
-
227
-
228
-
229
-
230
-
231
-
232
-
233
-
234
-
235
-
236
-
237
-
238
-
239
-
240
-
241
-
242
-
243
-
244
-
245
-
246
-
247
-
248
-
249
-
250
-
251
-
252
-
253
-
254
-
255
-
256
-
257
-
258
-
259
-
260
-
261
-
262
-
263
-
264
-
265
-
266
-
267
-
268
-
269
-
270
-
271
-
272
-
273
-
274
-
275
-
276
-
277
-
278
-
279
-
280
-
281
-
282
-
283
-
284
-
285
-
286
-
287
-
288
-
289
-
290
-
291
-
292
-
293
-
294
-
295
-
296
-
297
-
298
-
299
-
300
-
301
-
302
-
303
-
304
-
305
-
306
-
307
-
308
-
309
-
310
-
311
-
312
-
313
-
314
-
315
-
316
-
317
-
318
-
319
-
320
-
321
-
322
-
323
-
324
-
325
-
326
-
327
-
328
-
329
-
330
-
331
-
332
-
333
-
334
-
335
-
336
-
337
-
338
-
339
-
340
-
341
-
342
-
343
-
344
-
345
-
346
-
347
-
348
-
349
-
350
-
351
-
352
-
353
-
354
-
355
-
356
-
357
-
358
-
359
-
360
-
361
-
362
-
363
-
364
-
365
-
366
-
367
-
368
-
369
-
370
-
371
-
372
-
373
-
374
 |
 |

REPORT ON
OPERATIONS
FINANCIAL
REVIEW -
FIAT GROUP
62
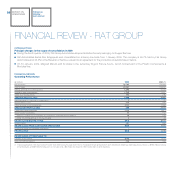
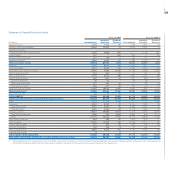
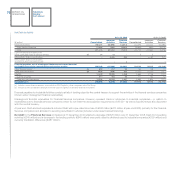
Following is a summary of the principal components of operating profit, broken down by Sector:
Gains/(losses)
Trading on the disposal Restructuring Other unusual Operating
profit/(loss) of investments costs income/(expense) profit/(loss)
(€ million) 2009 2008 2009 2008 2009 2008 2009 2008 2009 2008
Fiat Group Automobiles 470 691 - 18 54 62 (199) (187) 217 460
Maserati 11 72 - - - - - - 11 72
Ferrari 238 339 2 - - - 5 2 245 341
Agricultural and Construction
Equipment (CNH) 337 1,122 1 4 87 (14) - 6 251 1,146
Trucks and Commercial Vehicles (Iveco) 105 838 - 1 22 12 (173) (48) (90) 779
FPT Powertrain Technologies (25) 166 - 1 58 - (31) (5) (114) 162
Components (Magneti Marelli) 25 174 (3) - 62 77 - (4) (40) 93
Metallurgical Products (Teksid) (12) 41 - - 4 5 2 13 (14) 49
Production Systems (Comau) (28) 21 1 - 5 3 - (18) (32) -
Other Businesses and Eliminations (63) (102) 3 (4) 20 20 5 (4) (75) (130)
Total for the Group 1,058 3,362 4 20 312 165 (391) (245) 359 2,972
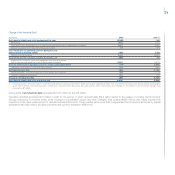
Profit/(loss)
Net financial expense totalled €753 million (€947 million for 2008) and included a €117 million gain in the mark-to-market value of two stock
option-related equity swaps (a €263 million loss in 2008). Excluding the effect of those equity swaps, financial expense for the year increased €186
million, primarily due to the higher level of debt existing during the year.
Investment income for 2009 totalled €27 million, down from the €162 million figure for 2008 mainly due to a decrease in earnings for certain
joint venture companies.
The Group recorded a loss before taxes of €367 million (profit before taxes of €2,187 million for 2008). This reflects the significantly lower operating
profit (down €2,613 million) and a decrease in investment income (down €135 million), which were partially compensated for by a €194 million decrease
in net financial expense.
Income taxes totalled €481 million (€466 million for 2008), of which €99 million for IRAP (€168 million for 2008) and €24 million for taxes relating to prior
periods €23 million for 2008) with the remainder relating to the taxable income of companies operating outside Italy.
The year closed with a net loss of €848 million, compared with a profit of €1,721 million for 2008.
The loss attributable to owners of the parent was €838 million (profit of €1,612 million for 2008).