Chrysler 2009 Annual Report Download - page 72
Download and view the complete annual report
Please find page 72 of the 2009 Chrysler annual report below. You can navigate through the pages in the report by either clicking on the pages listed below, or by using the keyword search tool below to find specific information within the annual report.-
 1
1 -
2
-
3
-
4
-
5
-
6
-
7
-
8
-
9
-
10
-
11
-
12
-
13
-
14
-
15
-
16
-
17
-
18
-
19
-
20
-
21
-
22
-
23
-
24
-
25
-
26
-
27
-
28
-
29
-
30
-
31
-
32
-
33
-
34
-
35
-
36
-
37
-
38
-
39
-
40
-
41
-
42
-
43
-
44
-
45
-
46
-
47
-
48
-
49
-
50
-
51
-
52
-
53
-
54
-
55
-
56
-
57
-
58
-
59
-
60
-
61
-
 62
62 -
 63
63 -
 64
64 -
 65
65 -
 66
66 -
 67
67 -
 68
68 -
 69
69 -
 70
70 -
 71
71 -
 72
72 -
 73
73 -
 74
74 -
 75
75 -
 76
76 -
 77
77 -
 78
78 -
 79
79 -
 80
80 -
 81
81 -
 82
82 -
83
-
84
-
85
-
86
-
87
-
88
-
89
-
90
-
91
-
92
-
93
-
94
-
95
-
96
-
97
-
98
-
99
-
100
-
101
-
102
-
103
-
104
-
105
-
106
-
107
-
108
-
109
-
110
-
111
-
112
-
113
-
114
-
115
-
116
-
117
-
118
-
119
-
120
-
121
-
122
-
123
-
124
-
125
-
126
-
127
-
128
-
129
-
130
-
131
-
132
-
133
-
134
-
135
-
136
-
137
-
138
-
139
-
140
-
141
-
142
-
143
-
144
-
145
-
146
-
147
-
148
-
149
-
150
-
151
-
152
-
153
-
154
-
155
-
156
-
157
-
158
-
159
-
160
-
161
-
162
-
163
-
164
-
165
-
166
-
167
-
168
-
169
-
170
-
171
-
172
-
173
-
174
-
175
-
176
-
177
-
178
-
179
-
180
-
181
-
182
-
183
-
184
-
185
-
186
-
187
-
188
-
189
-
190
-
191
-
192
-
193
-
194
-
195
-
196
-
197
-
198
-
199
-
200
-
201
-
202
-
203
-
204
-
205
-
206
-
207
-
208
-
209
-
210
-
211
-
212
-
213
-
214
-
215
-
216
-
217
-
218
-
219
-
220
-
221
-
222
-
223
-
224
-
225
-
226
-
227
-
228
-
229
-
230
-
231
-
232
-
233
-
234
-
235
-
236
-
237
-
238
-
239
-
240
-
241
-
242
-
243
-
244
-
245
-
246
-
247
-
248
-
249
-
250
-
251
-
252
-
253
-
254
-
255
-
256
-
257
-
258
-
259
-
260
-
261
-
262
-
263
-
264
-
265
-
266
-
267
-
268
-
269
-
270
-
271
-
272
-
273
-
274
-
275
-
276
-
277
-
278
-
279
-
280
-
281
-
282
-
283
-
284
-
285
-
286
-
287
-
288
-
289
-
290
-
291
-
292
-
293
-
294
-
295
-
296
-
297
-
298
-
299
-
300
-
301
-
302
-
303
-
304
-
305
-
306
-
307
-
308
-
309
-
310
-
311
-
312
-
313
-
314
-
315
-
316
-
317
-
318
-
319
-
320
-
321
-
322
-
323
-
324
-
325
-
326
-
327
-
328
-
329
-
330
-
331
-
332
-
333
-
334
-
335
-
336
-
337
-
338
-
339
-
340
-
341
-
342
-
343
-
344
-
345
-
346
-
347
-
348
-
349
-
350
-
351
-
352
-
353
-
354
-
355
-
356
-
357
-
358
-
359
-
360
-
361
-
362
-
363
-
364
-
365
-
366
-
367
-
368
-
369
-
370
-
371
-
372
-
373
-
374
 |
 |

71
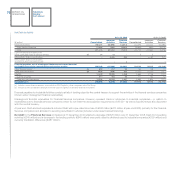
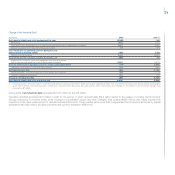
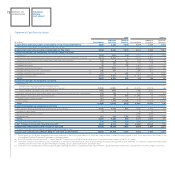
Change in Net Industrial Debt
(€ million) 2009 2008 (*)
Net industrial (debt)/cash at the beginning of the year (5,949) 355
Profit/(loss) (848) 1,721
Amortisation and depreciation (net of vehicles sold under buy-back commitments or leased) 2,667 2,802
Change in provisions for risks and charges and similar 118 (769)
Cash from/(used in) operating activities during the year
before change in working capital 1,937 3,754
Change in working capital 2,564 (3,604)
Cash from/(used in) operating activities during the year 4,501 150
Investments in property, plant and equipment and intangible assets
(net of vehicles sold under buy-back commitments or leased) (3,382) (4,973)
Net cash from/(used in) operating activities, net of capital expenditures 1,119 (4,823)
Change in consolidation scope and other changes 525 (942)
Net industrial cash flow 1,644 (5,765)
Capital increases, (purchase)/disposal of own shares and dividends (20) (770)
Currency translation differences (93) 231
Change in net industrial debt 1,531 (6,304)
Net industrial (debt)/cash at the end of the year (4,418) (5,949)
(*) Following adoption of the improvement to IAS 16 in 2009, amounts previously reported for 2008 “Cash used in operating activities” and “Investments in property, plant and equipment and intangible
assets (net of vehicles sold under buy-back commitments or leased)” were reduced by €6 million and €7 million, respectively, and “Changes in consolidation scope and other changes” was
increased by €1 million.
During 2009, net industrial debt decreased €1,531 million to €4,418 million.
Operating activities generated €4.5 billion in cash for the period, of which approximately €2.6 billion related to the release of working capital primarily
through reductions in inventory levels, while “Change in consolidation scope and other changes” was positive (€525 million) and mainly included the
impacts from fair value measurement of derivate financial instruments. These positive items more than compensated for the amount absorbed by capital
expenditure (€3,382 million), dividend payments and currency translation differences.