Chrysler 2009 Annual Report Download - page 310
Download and view the complete annual report
Please find page 310 of the 2009 Chrysler annual report below. You can navigate through the pages in the report by either clicking on the pages listed below, or by using the keyword search tool below to find specific information within the annual report.-
 1
1 -
2
-
3
-
4
-
5
-
6
-
7
-
8
-
9
-
10
-
11
-
12
-
13
-
14
-
15
-
16
-
17
-
18
-
19
-
20
-
21
-
22
-
23
-
24
-
25
-
26
-
27
-
28
-
29
-
30
-
31
-
32
-
33
-
34
-
35
-
36
-
37
-
38
-
39
-
40
-
41
-
42
-
43
-
44
-
45
-
46
-
47
-
48
-
49
-
50
-
51
-
52
-
53
-
54
-
55
-
56
-
57
-
58
-
59
-
60
-
61
-
62
-
63
-
64
-
65
-
66
-
67
-
68
-
69
-
70
-
71
-
72
-
73
-
74
-
75
-
76
-
77
-
78
-
79
-
80
-
81
-
82
-
83
-
84
-
85
-
86
-
87
-
88
-
89
-
90
-
91
-
92
-
93
-
94
-
95
-
96
-
97
-
98
-
99
-
100
-
101
-
102
-
103
-
104
-
105
-
106
-
107
-
108
-
109
-
110
-
111
-
112
-
113
-
114
-
115
-
116
-
117
-
118
-
119
-
120
-
121
-
122
-
123
-
124
-
125
-
126
-
127
-
128
-
129
-
130
-
131
-
132
-
133
-
134
-
135
-
136
-
137
-
138
-
139
-
140
-
141
-
142
-
143
-
144
-
145
-
146
-
147
-
148
-
149
-
150
-
151
-
152
-
153
-
154
-
155
-
156
-
157
-
158
-
159
-
160
-
161
-
162
-
163
-
164
-
165
-
166
-
167
-
168
-
169
-
170
-
171
-
172
-
173
-
174
-
175
-
176
-
177
-
178
-
179
-
180
-
181
-
182
-
183
-
184
-
185
-
186
-
187
-
188
-
189
-
190
-
191
-
192
-
193
-
194
-
195
-
196
-
197
-
198
-
199
-
200
-
201
-
202
-
203
-
204
-
205
-
206
-
207
-
208
-
209
-
210
-
211
-
212
-
213
-
214
-
215
-
216
-
217
-
218
-
219
-
220
-
221
-
222
-
223
-
224
-
225
-
226
-
227
-
228
-
229
-
230
-
231
-
232
-
233
-
234
-
235
-
236
-
237
-
238
-
239
-
240
-
241
-
242
-
243
-
244
-
245
-
246
-
247
-
248
-
249
-
250
-
251
-
252
-
253
-
254
-
255
-
256
-
257
-
258
-
259
-
260
-
261
-
262
-
263
-
264
-
265
-
266
-
267
-
268
-
269
-
270
-
271
-
272
-
273
-
274
-
275
-
276
-
277
-
278
-
279
-
280
-
281
-
282
-
283
-
284
-
285
-
286
-
287
-
288
-
289
-
290
-
291
-
292
-
293
-
294
-
295
-
296
-
297
-
298
-
299
-
 300
300 -
 301
301 -
 302
302 -
 303
303 -
 304
304 -
 305
305 -
 306
306 -
 307
307 -
 308
308 -
 309
309 -
 310
310 -
 311
311 -
 312
312 -
 313
313 -
 314
314 -
 315
315 -
 316
316 -
 317
317 -
 318
318 -
 319
319 -
 320
320 -
321
-
322
-
323
-
324
-
325
-
326
-
327
-
328
-
329
-
330
-
331
-
332
-
333
-
334
-
335
-
336
-
337
-
338
-
339
-
340
-
341
-
342
-
343
-
344
-
345
-
346
-
347
-
348
-
349
-
350
-
351
-
352
-
353
-
354
-
355
-
356
-
357
-
358
-
359
-
360
-
361
-
362
-
363
-
364
-
365
-
366
-
367
-
368
-
369
-
370
-
371
-
372
-
373
-
374
 |
 |

309
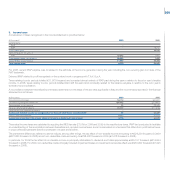
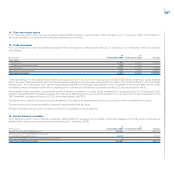
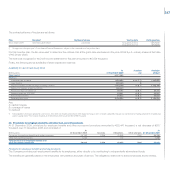
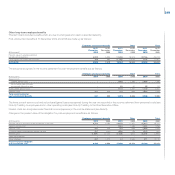
18. Cash and cash equivalents
Cash and cash equivalents consist of the following:
(€ thousand) At 31 December 2009 At 31 December 2008 Change
Cash at banks and post offices 473 494 (21)
Cheques and cash in hand 1 1 -
Total cash and cash equivalents 474 495 (21)
The above figures related to on demand deposits in euros in the Company’s current accounts. The carrying amount of cash and cash equivalents is deemed
to be in line with their fair value.
The credit risk relating to cash and cash equivalents is insignificant since the counterparties are leading national and international banks.
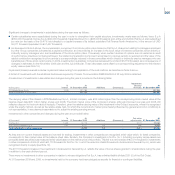
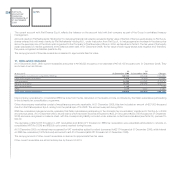
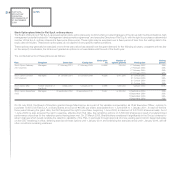
19. Equity
At 31 December 2009, equity totalled €12,486,847 thousand, a €317,103 thousand increase over 31 December 2008, primarily attributable to profit for
the year of €339,964 thousand net of dividend distributions of €24,773 thousand (€0.31 to each savings share).
Share capital
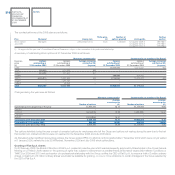
Share capital totalled €6,377,263 thousand (fully paid) at 31 December 2009 and consisted of the following:
(no. of shares) At 31 December 2009
At 31 December 2008
Shares issued and fully paid-up
Ordinary shares 1,092,247,485 1,092,247,485
Preference shares 103,292,310 103,292,310
Savings shares 79,912,800 79,912,800
Total shares issued 1,275,452,595 1,275,452,595
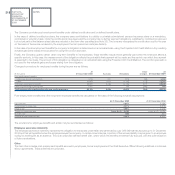
All issued shares have a nominal value of €5 each, with each category having rights as follows.
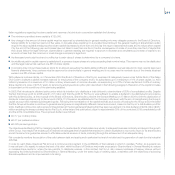
Each share confers the right to share pro rata in any earnings allocated for distribution and any surplus assets remaining upon a winding-up, subject to the
right of priority of preference and savings shares as described here below.
Each ordinary share confers the right to vote without any restriction whatsoever. Each preference share confers the right to vote only on matters which are
reserved for an Extraordinary Meeting of Shareholders and on resolutions concerning Procedures for General Meetings. No voting rights are attached to
savings shares.