Chrysler 2009 Annual Report Download - page 320
Download and view the complete annual report
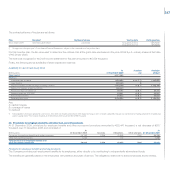
Please find page 320 of the 2009 Chrysler annual report below. You can navigate through the pages in the report by either clicking on the pages listed below, or by using the keyword search tool below to find specific information within the annual report.-
 1
1 -
2
-
3
-
4
-
5
-
6
-
7
-
8
-
9
-
10
-
11
-
12
-
13
-
14
-
15
-
16
-
17
-
18
-
19
-
20
-
21
-
22
-
23
-
24
-
25
-
26
-
27
-
28
-
29
-
30
-
31
-
32
-
33
-
34
-
35
-
36
-
37
-
38
-
39
-
40
-
41
-
42
-
43
-
44
-
45
-
46
-
47
-
48
-
49
-
50
-
51
-
52
-
53
-
54
-
55
-
56
-
57
-
58
-
59
-
60
-
61
-
62
-
63
-
64
-
65
-
66
-
67
-
68
-
69
-
70
-
71
-
72
-
73
-
74
-
75
-
76
-
77
-
78
-
79
-
80
-
81
-
82
-
83
-
84
-
85
-
86
-
87
-
88
-
89
-
90
-
91
-
92
-
93
-
94
-
95
-
96
-
97
-
98
-
99
-
100
-
101
-
102
-
103
-
104
-
105
-
106
-
107
-
108
-
109
-
110
-
111
-
112
-
113
-
114
-
115
-
116
-
117
-
118
-
119
-
120
-
121
-
122
-
123
-
124
-
125
-
126
-
127
-
128
-
129
-
130
-
131
-
132
-
133
-
134
-
135
-
136
-
137
-
138
-
139
-
140
-
141
-
142
-
143
-
144
-
145
-
146
-
147
-
148
-
149
-
150
-
151
-
152
-
153
-
154
-
155
-
156
-
157
-
158
-
159
-
160
-
161
-
162
-
163
-
164
-
165
-
166
-
167
-
168
-
169
-
170
-
171
-
172
-
173
-
174
-
175
-
176
-
177
-
178
-
179
-
180
-
181
-
182
-
183
-
184
-
185
-
186
-
187
-
188
-
189
-
190
-
191
-
192
-
193
-
194
-
195
-
196
-
197
-
198
-
199
-
200
-
201
-
202
-
203
-
204
-
205
-
206
-
207
-
208
-
209
-
210
-
211
-
212
-
213
-
214
-
215
-
216
-
217
-
218
-
219
-
220
-
221
-
222
-
223
-
224
-
225
-
226
-
227
-
228
-
229
-
230
-
231
-
232
-
233
-
234
-
235
-
236
-
237
-
238
-
239
-
240
-
241
-
242
-
243
-
244
-
245
-
246
-
247
-
248
-
249
-
250
-
251
-
252
-
253
-
254
-
255
-
256
-
257
-
258
-
259
-
260
-
261
-
262
-
263
-
264
-
265
-
266
-
267
-
268
-
269
-
270
-
271
-
272
-
273
-
274
-
275
-
276
-
277
-
278
-
279
-
280
-
281
-
282
-
283
-
284
-
285
-
286
-
287
-
288
-
289
-
290
-
291
-
292
-
293
-
294
-
295
-
296
-
297
-
298
-
299
-
300
-
301
-
302
-
303
-
304
-
305
-
306
-
307
-
308
-
309
-
 310
310 -
 311
311 -
 312
312 -
 313
313 -
 314
314 -
 315
315 -
 316
316 -
 317
317 -
 318
318 -
 319
319 -
 320
320 -
 321
321 -
 322
322 -
 323
323 -
 324
324 -
 325
325 -
 326
326 -
 327
327 -
 328
328 -
 329
329 -
 330
330 -
331
-
332
-
333
-
334
-
335
-
336
-
337
-
338
-
339
-
340
-
341
-
342
-
343
-
344
-
345
-
346
-
347
-
348
-
349
-
350
-
351
-
352
-
353
-
354
-
355
-
356
-
357
-
358
-
359
-
360
-
361
-
362
-
363
-
364
-
365
-
366
-
367
-
368
-
369
-
370
-
371
-
372
-
373
-
374
 |
 |

319
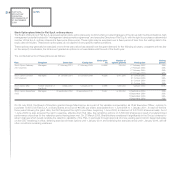
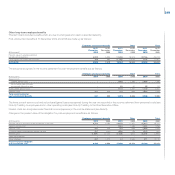
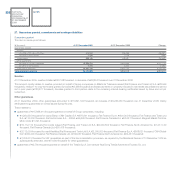
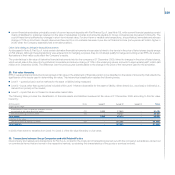
Other long-term employee benefits
This item mainly includes benefits which are due to employees who reach a specified seniority.
Post-employment benefits at 31 December 2009 and 2008 are made up as follows:
Employee severance indemnity Other Total
At 31 At 31 At 31 At 31 At 31 At 31
December December December December December December
(€ thousand) 2009 2008 2009 2008 2009 2008
Present value of unfunded defined
benefit plan obligations 6,280 6,334 17,486 18,679 23,766 25,013
Unrecognised actuarial gains/(losses) 708 685 (1,182) (1,876) (474) (1,191)
Net liability 6,988 7,019 16,304 16,803 23,292 23,822
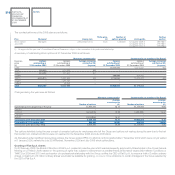
The amounts recognised in the income statement for post-employment benefits are as follows:
Employee severance indemnity Other Total
(€ thousand) 2009 2008 2009 2008 2009 2008
Service cost:
Current service cost - - 1,084 1,296 1,084 1,296
Net actuarial (gains)/losses
recognised during the year - - 88 51 88 51
Total current service cost - - 1,172 1,347 1,172 1,347
Interest costs 341 309 743 699 1,084 1,008
Total cost/(income) for
post-employment benefits 341 309 1,915 2,046 2,256 2,355
The items current service cost and net actuarial (gains) losses recognised during the year are recorded in the income statement item personnel costs (see
Note 5) if relating to employees and in other operating costs (see Note 6) if relating to the Chief Executive Officer.
Interest costs are recognised under financial income/(expense) in the income statement (see Note 8).
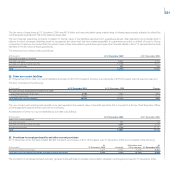
Changes in the present value of the obligation for post-employment benefits are as follows:
Employee severance indemnity Other Total
(€ thousand) 2009 2008 2009 2008 2009 2008
Present value of obligation at the beginning of the year 6,334 6,280 18,679 11,851 25,013 18,131
Current service cost - - 1,084 1,296 1,084 1,296
Interest costs 341 309 743 699 1,084 1,008
Actuarial (gains)/losses arising during the year 397 (202) (834) 733 (437) 531
Benefits paid (1,059) (1,123) (2,230) (540) (3,289) (1,663)
Gains on reduction - - - - - -
Other changes 267 1,070 44 4,640 311 5,710
Present value of obligation
at the end of the year 6,280 6,334 17,486 18,679 23,766 25,013