Chrysler 2009 Annual Report Download - page 140
Download and view the complete annual report
Please find page 140 of the 2009 Chrysler annual report below. You can navigate through the pages in the report by either clicking on the pages listed below, or by using the keyword search tool below to find specific information within the annual report.-
 1
1 -
2
-
3
-
4
-
5
-
6
-
7
-
8
-
9
-
10
-
11
-
12
-
13
-
14
-
15
-
16
-
17
-
18
-
19
-
20
-
21
-
22
-
23
-
24
-
25
-
26
-
27
-
28
-
29
-
30
-
31
-
32
-
33
-
34
-
35
-
36
-
37
-
38
-
39
-
40
-
41
-
42
-
43
-
44
-
45
-
46
-
47
-
48
-
49
-
50
-
51
-
52
-
53
-
54
-
55
-
56
-
57
-
58
-
59
-
60
-
61
-
62
-
63
-
64
-
65
-
66
-
67
-
68
-
69
-
70
-
71
-
72
-
73
-
74
-
75
-
76
-
77
-
78
-
79
-
80
-
81
-
82
-
83
-
84
-
85
-
86
-
87
-
88
-
89
-
90
-
91
-
92
-
93
-
94
-
95
-
96
-
97
-
98
-
99
-
100
-
101
-
102
-
103
-
104
-
105
-
106
-
107
-
108
-
109
-
110
-
111
-
112
-
113
-
114
-
115
-
116
-
117
-
118
-
119
-
120
-
121
-
122
-
123
-
124
-
125
-
126
-
127
-
128
-
129
-
 130
130 -
 131
131 -
 132
132 -
 133
133 -
 134
134 -
 135
135 -
 136
136 -
 137
137 -
 138
138 -
 139
139 -
 140
140 -
 141
141 -
 142
142 -
 143
143 -
 144
144 -
 145
145 -
 146
146 -
 147
147 -
 148
148 -
 149
149 -
 150
150 -
151
-
152
-
153
-
154
-
155
-
156
-
157
-
158
-
159
-
160
-
161
-
162
-
163
-
164
-
165
-
166
-
167
-
168
-
169
-
170
-
171
-
172
-
173
-
174
-
175
-
176
-
177
-
178
-
179
-
180
-
181
-
182
-
183
-
184
-
185
-
186
-
187
-
188
-
189
-
190
-
191
-
192
-
193
-
194
-
195
-
196
-
197
-
198
-
199
-
200
-
201
-
202
-
203
-
204
-
205
-
206
-
207
-
208
-
209
-
210
-
211
-
212
-
213
-
214
-
215
-
216
-
217
-
218
-
219
-
220
-
221
-
222
-
223
-
224
-
225
-
226
-
227
-
228
-
229
-
230
-
231
-
232
-
233
-
234
-
235
-
236
-
237
-
238
-
239
-
240
-
241
-
242
-
243
-
244
-
245
-
246
-
247
-
248
-
249
-
250
-
251
-
252
-
253
-
254
-
255
-
256
-
257
-
258
-
259
-
260
-
261
-
262
-
263
-
264
-
265
-
266
-
267
-
268
-
269
-
270
-
271
-
272
-
273
-
274
-
275
-
276
-
277
-
278
-
279
-
280
-
281
-
282
-
283
-
284
-
285
-
286
-
287
-
288
-
289
-
290
-
291
-
292
-
293
-
294
-
295
-
296
-
297
-
298
-
299
-
300
-
301
-
302
-
303
-
304
-
305
-
306
-
307
-
308
-
309
-
310
-
311
-
312
-
313
-
314
-
315
-
316
-
317
-
318
-
319
-
320
-
321
-
322
-
323
-
324
-
325
-
326
-
327
-
328
-
329
-
330
-
331
-
332
-
333
-
334
-
335
-
336
-
337
-
338
-
339
-
340
-
341
-
342
-
343
-
344
-
345
-
346
-
347
-
348
-
349
-
350
-
351
-
352
-
353
-
354
-
355
-
356
-
357
-
358
-
359
-
360
-
361
-
362
-
363
-
364
-
365
-
366
-
367
-
368
-
369
-
370
-
371
-
372
-
373
-
374
 |
 |

139
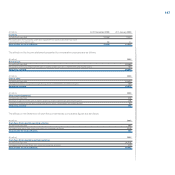
Inventories
Inventories of raw materials, semi finished products and finished goods, (including assets leased out under operating leases
and assets sold under a buy-back commitment that are held for sale) are stated at the lower of cost and net realisable value,
cost being determined on a first in-first-out (FIFO) basis. The measurement of inventories includes the direct costs of materials,
labour and indirect costs (variable and fixed). Provision is made for obsolete and slow-moving raw materials, finished goods,
spare parts and other supplies based on their expected future use and realisable value. Net realisable value is the estimated
selling price in the ordinary course of business less the estimated costs of completion and the estimated costs for sale and
distribution.
The measurement of construction contracts is based on the stage of completion determined as the proportion that cost incurred
to balance sheet date bear to the estimated total contract cost. These items are presented net of progress billings received from
customers. Any losses on such contracts are fully recorded in the income statement when they become known.
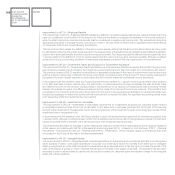
Assets held for sale
Assets held for sale include non-current assets (or assets included in disposal groups) whose carrying amount will be recovered
principally through a sale transaction rather than through continuing use. Assets held for sale are measured at the lower of their
carrying amount and fair value less disposal costs.
Employee benefits
Pension plans
Employees of the Group participate in several defined benefit and/or defined contribution pension plans in accordance with local
conditions and practices in the countries in which the Group operates.
The Group’s obligation to fund defined benefit pension plans and the annual cost recognised in the income statement are
determined on an actuarial basis using the projected unit credit method. The portion of net cumulative actuarial gains and losses
which exceeds the greater of 10% of the present value of the defined benefit obligation and 10% of the fair value of plan assets
at the end of the previous year is amortised over the average remaining service lives of the employees (the “corridor approach”).
In the context of IFRS First-time Adoption, the Group elected to recognise all cumulative actuarial gains and losses that existed
at 1 January 2004, even though it has decided to use the corridor approach for subsequent actuarial gains and losses.
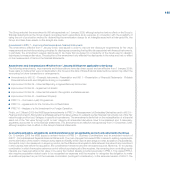
The post-employment benefit obligation recognised in the statement of financial position represents the present value of
the defined benefit obligation as adjusted for unrecognised actuarial gains and losses, arising from the application of the
corridor method and unrecognised past service cost, reduced by the fair value of plan assets. Any net asset resulting from this
calculation is recognised at the lower of its amount and the total of any cumulative unrecognised net actuarial losses and past
service cost, and the present value of any economic benefits available in the form of refunds from the plan or reductions in future
contributions to the plan.
If changes are made to a plan that alters the benefits due for past service or if a new plan is introduced regarding past service
then past service costs are recognised in the income statement on a straight-line basis over the average period remaining
until the benefits become vested. If a change is made to a plan that significantly reduces the number of employees who are
members of the plan or that alters the conditions of the plan such that employees will no longer be entitled to the same benefits
for a significant part of their future service, or if such benefits will be reduced, the profit or loss arising from such changes is
immediately recognised in the income statement.
All other costs and income arising from the measurement of pension plan provisions are allocated to costs by function in the
income statement, except for interest cost on unfunded defined benefit plans which is reported as part of Financial expenses.
Costs arising from defined contribution plans are recognised as an expense in the income statement as incurred.