Chrysler 2009 Annual Report Download - page 116
Download and view the complete annual report
Please find page 116 of the 2009 Chrysler annual report below. You can navigate through the pages in the report by either clicking on the pages listed below, or by using the keyword search tool below to find specific information within the annual report.-
 1
1 -
2
-
3
-
4
-
5
-
6
-
7
-
8
-
9
-
10
-
11
-
12
-
13
-
14
-
15
-
16
-
17
-
18
-
19
-
20
-
21
-
22
-
23
-
24
-
25
-
26
-
27
-
28
-
29
-
30
-
31
-
32
-
33
-
34
-
35
-
36
-
37
-
38
-
39
-
40
-
41
-
42
-
43
-
44
-
45
-
46
-
47
-
48
-
49
-
50
-
51
-
52
-
53
-
54
-
55
-
56
-
57
-
58
-
59
-
60
-
61
-
62
-
63
-
64
-
65
-
66
-
67
-
68
-
69
-
70
-
71
-
72
-
73
-
74
-
75
-
76
-
77
-
78
-
79
-
80
-
81
-
82
-
83
-
84
-
85
-
86
-
87
-
88
-
89
-
90
-
91
-
92
-
93
-
94
-
95
-
96
-
97
-
98
-
99
-
100
-
101
-
102
-
103
-
104
-
105
-
 106
106 -
 107
107 -
 108
108 -
 109
109 -
 110
110 -
 111
111 -
 112
112 -
 113
113 -
 114
114 -
 115
115 -
 116
116 -
 117
117 -
 118
118 -
 119
119 -
 120
120 -
 121
121 -
 122
122 -
 123
123 -
 124
124 -
 125
125 -
 126
126 -
127
-
128
-
129
-
130
-
131
-
132
-
133
-
134
-
135
-
136
-
137
-
138
-
139
-
140
-
141
-
142
-
143
-
144
-
145
-
146
-
147
-
148
-
149
-
150
-
151
-
152
-
153
-
154
-
155
-
156
-
157
-
158
-
159
-
160
-
161
-
162
-
163
-
164
-
165
-
166
-
167
-
168
-
169
-
170
-
171
-
172
-
173
-
174
-
175
-
176
-
177
-
178
-
179
-
180
-
181
-
182
-
183
-
184
-
185
-
186
-
187
-
188
-
189
-
190
-
191
-
192
-
193
-
194
-
195
-
196
-
197
-
198
-
199
-
200
-
201
-
202
-
203
-
204
-
205
-
206
-
207
-
208
-
209
-
210
-
211
-
212
-
213
-
214
-
215
-
216
-
217
-
218
-
219
-
220
-
221
-
222
-
223
-
224
-
225
-
226
-
227
-
228
-
229
-
230
-
231
-
232
-
233
-
234
-
235
-
236
-
237
-
238
-
239
-
240
-
241
-
242
-
243
-
244
-
245
-
246
-
247
-
248
-
249
-
250
-
251
-
252
-
253
-
254
-
255
-
256
-
257
-
258
-
259
-
260
-
261
-
262
-
263
-
264
-
265
-
266
-
267
-
268
-
269
-
270
-
271
-
272
-
273
-
274
-
275
-
276
-
277
-
278
-
279
-
280
-
281
-
282
-
283
-
284
-
285
-
286
-
287
-
288
-
289
-
290
-
291
-
292
-
293
-
294
-
295
-
296
-
297
-
298
-
299
-
300
-
301
-
302
-
303
-
304
-
305
-
306
-
307
-
308
-
309
-
310
-
311
-
312
-
313
-
314
-
315
-
316
-
317
-
318
-
319
-
320
-
321
-
322
-
323
-
324
-
325
-
326
-
327
-
328
-
329
-
330
-
331
-
332
-
333
-
334
-
335
-
336
-
337
-
338
-
339
-
340
-
341
-
342
-
343
-
344
-
345
-
346
-
347
-
348
-
349
-
350
-
351
-
352
-
353
-
354
-
355
-
356
-
357
-
358
-
359
-
360
-
361
-
362
-
363
-
364
-
365
-
366
-
367
-
368
-
369
-
370
-
371
-
372
-
373
-
374
 |
 |

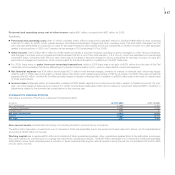
115
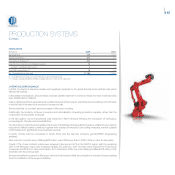
PRODUCTION SYSTEMS
Comau
HIGHLIGHTS
(E million) 2009 2008
Net revenues 728 1,123
Trading profit/(loss) (28) 21
Operating profit/(loss) (*) (32) -
Investments in tangible and intangible assets 13 17
of which capitalised R&D costs 2 3
Total R&D expenditure (**) 10 13
No. of employees at year end 11,708 11,445
(*) Including restructuring costs and other unusual income/(expense).
(**) Includes capitalised R&D and R&D charged directly to the income statement.
OPERATING PERFORMANCE
In 2009, the Sector’s reference market was negatively impacted by the global financial and industrial crisis which
affected all markets.
In the western hemisphere, all automakers reduced capital investment to minimum levels and new model launches
were scaled back or delayed.
Cuts in capital investment were less severe in Mercosur and China however, with limited new investment commitments
in the first half of the year but a recovery in the second half.
Service activities, by contrast, saw an increase in Mercosur countries.
Additionally, the tendency to favour conversion and rationalisation of existing production capacity, rather than the
construction of new plants, continued.
In the last quarter, some improvement was observed in North America following the conclusion of bankruptcy
proceedings for Chrysler and General Motors.
Comau’s plan to restructure and redefine the scope of its activities and geographic presence, initiated in prior years in
response to difficult market conditions, together with a series of temporary cost-cutting measures, made it possible
to limit losses from significantly lower business volumes.
In 2009, Comau sold its companies in South Africa and the German company germanINTEC (engineering
activities).
New orders for contract work, totalling €528 million, were 38% lower than in 2008 (-36% on a like-for-like basis).
Overall, 27% of new contract orders were acquired in Europe and 47% in the NAFTA region, with the remaining
26% in the Mercosur region and emerging markets. By customer, 20% of orders were received from Fiat Group
companies and 80% from other automakers. At 31 December 2009, the order backlog totalled €478 million, a 9%
decrease over the previous year.
Services benefited from growth in Mercosur, which did not however offset the contraction in orders in Europe resulting
from the redefinition of the scope of activities.