Chrysler 2009 Annual Report Download - page 102
Download and view the complete annual report
Please find page 102 of the 2009 Chrysler annual report below. You can navigate through the pages in the report by either clicking on the pages listed below, or by using the keyword search tool below to find specific information within the annual report.-
 1
1 -
2
-
3
-
4
-
5
-
6
-
7
-
8
-
9
-
10
-
11
-
12
-
13
-
14
-
15
-
16
-
17
-
18
-
19
-
20
-
21
-
22
-
23
-
24
-
25
-
26
-
27
-
28
-
29
-
30
-
31
-
32
-
33
-
34
-
35
-
36
-
37
-
38
-
39
-
40
-
41
-
42
-
43
-
44
-
45
-
46
-
47
-
48
-
49
-
50
-
51
-
52
-
53
-
54
-
55
-
56
-
57
-
58
-
59
-
60
-
61
-
62
-
63
-
64
-
65
-
66
-
67
-
68
-
69
-
70
-
71
-
72
-
73
-
74
-
75
-
76
-
77
-
78
-
79
-
80
-
81
-
82
-
83
-
84
-
85
-
86
-
87
-
88
-
89
-
90
-
91
-
 92
92 -
 93
93 -
 94
94 -
 95
95 -
 96
96 -
 97
97 -
 98
98 -
 99
99 -
 100
100 -
 101
101 -
 102
102 -
 103
103 -
 104
104 -
 105
105 -
 106
106 -
 107
107 -
 108
108 -
 109
109 -
 110
110 -
 111
111 -
 112
112 -
113
-
114
-
115
-
116
-
117
-
118
-
119
-
120
-
121
-
122
-
123
-
124
-
125
-
126
-
127
-
128
-
129
-
130
-
131
-
132
-
133
-
134
-
135
-
136
-
137
-
138
-
139
-
140
-
141
-
142
-
143
-
144
-
145
-
146
-
147
-
148
-
149
-
150
-
151
-
152
-
153
-
154
-
155
-
156
-
157
-
158
-
159
-
160
-
161
-
162
-
163
-
164
-
165
-
166
-
167
-
168
-
169
-
170
-
171
-
172
-
173
-
174
-
175
-
176
-
177
-
178
-
179
-
180
-
181
-
182
-
183
-
184
-
185
-
186
-
187
-
188
-
189
-
190
-
191
-
192
-
193
-
194
-
195
-
196
-
197
-
198
-
199
-
200
-
201
-
202
-
203
-
204
-
205
-
206
-
207
-
208
-
209
-
210
-
211
-
212
-
213
-
214
-
215
-
216
-
217
-
218
-
219
-
220
-
221
-
222
-
223
-
224
-
225
-
226
-
227
-
228
-
229
-
230
-
231
-
232
-
233
-
234
-
235
-
236
-
237
-
238
-
239
-
240
-
241
-
242
-
243
-
244
-
245
-
246
-
247
-
248
-
249
-
250
-
251
-
252
-
253
-
254
-
255
-
256
-
257
-
258
-
259
-
260
-
261
-
262
-
263
-
264
-
265
-
266
-
267
-
268
-
269
-
270
-
271
-
272
-
273
-
274
-
275
-
276
-
277
-
278
-
279
-
280
-
281
-
282
-
283
-
284
-
285
-
286
-
287
-
288
-
289
-
290
-
291
-
292
-
293
-
294
-
295
-
296
-
297
-
298
-
299
-
300
-
301
-
302
-
303
-
304
-
305
-
306
-
307
-
308
-
309
-
310
-
311
-
312
-
313
-
314
-
315
-
316
-
317
-
318
-
319
-
320
-
321
-
322
-
323
-
324
-
325
-
326
-
327
-
328
-
329
-
330
-
331
-
332
-
333
-
334
-
335
-
336
-
337
-
338
-
339
-
340
-
341
-
342
-
343
-
344
-
345
-
346
-
347
-
348
-
349
-
350
-
351
-
352
-
353
-
354
-
355
-
356
-
357
-
358
-
359
-
360
-
361
-
362
-
363
-
364
-
365
-
366
-
367
-
368
-
369
-
370
-
371
-
372
-
373
-
374
 |
 |

101
TRUCKS AND COMMERCIAL VEHICLES
Iveco
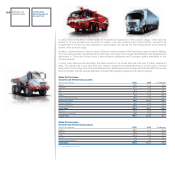
HIGHLIGHTS
(E million) 2009 2008(1)
Net revenues 7,183 10,894
Trading profit/(loss) 105 838
Operating profit/(loss) (*) (90) 779
Investments in tangible and intangible assets (**) 217 367
of which capitalised R&D costs 84 120
Total R&D expenditure (***) 169 246
No. of employees at year end (****) 24,917 27,108
(1) Following adoption of the improvement to IAS 16 in 2009, as described in the Notes to the Consolidated Financial Statements,
2008 net revenues were increased by €126 million and investments in tangible and intangible assets were reduced by €59 million.
(*) Including restructuring costs and other unusual income/(expense).
(**) Net of vehicles sold under buy-back commitments and leased.
(***) Includes capitalised R&D and R&D charged directly to the income statement.
(****) Excludes employees of the powertrain businesses transferred to FPT (7,685 at year-end 2009 and 8,335 at year-end 2008).
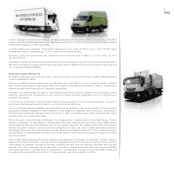
COMMERCIAL PERFORMANCE
In 2009, demand for commercial vehicles (Gross Vehicle Weight or “GVW” >_ 2.8 tonnes) in Western Europe
fell 34.6% over 2008 to 765,162 units, with significant declines in all major markets: Spain (-51.7%), the UK
(-40.6%), Italy (-33.6%), France (-30.0%) and Germany (-28.5%).
The light segment (GVW 2.8-6 tonnes) fell 31.7% over 2008. Significant decreases were recorded in Spain
(-45.3%), the UK (-39.9%), Italy (-29.4%) and France (-27.1%) and, to a lesser extent, Germany (-23.1%).
Demand in the medium segment (GVW 6.1-15.9 tonnes) fell 33.1% over 2008, with declines in all major
markets: Spain (-49.5%), the UK (-37.2%), Germany (-32.9%), Italy (-26.9%) and France (-26.5%).
The heavy segment (GVW >_ 16 tonnes) experienced the largest drop in demand for the year (-44.1%).
Particularly large decreases were recorded in Spain (-66.7%) and Italy (-50.5%). Germany, the UK and France
closed the year with declines in excess of 40% (-41.6%, -44.7% and -40.2% respectively).
For Eastern Europe (GVW >_ 2.8 tonnes), market demand totalled 69,669 units for 2009, a fall of 53.4% with
significant declines recorded in all three segments. Demand was down 43.8% in the light segment (GVW 2.8-6
tonnes) and 55.5% in the medium segment (GVW 6.1-15.9 tonnes). The sharpest decline, however, was in the
heavy segment (GVW >_ 16 tonnes), which was down 69.7%.
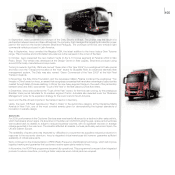
Demand for buses in Western Europe totalled 35,000 units, decreasing 11% over 2008 driven by falls in both
the Minibus and Truck Derived segment (-20%) and the Intercity & Coach segment (-15%), which were only
partially offset by growth in the City segment (+5%). Demand for buses was down in all Western European
markets with the exception of France, where it remained broadly stable.