Chrysler 2009 Annual Report Download - page 162
Download and view the complete annual report
Please find page 162 of the 2009 Chrysler annual report below. You can navigate through the pages in the report by either clicking on the pages listed below, or by using the keyword search tool below to find specific information within the annual report.-
 1
1 -
2
-
3
-
4
-
5
-
6
-
7
-
8
-
9
-
10
-
11
-
12
-
13
-
14
-
15
-
16
-
17
-
18
-
19
-
20
-
21
-
22
-
23
-
24
-
25
-
26
-
27
-
28
-
29
-
30
-
31
-
32
-
33
-
34
-
35
-
36
-
37
-
38
-
39
-
40
-
41
-
42
-
43
-
44
-
45
-
46
-
47
-
48
-
49
-
50
-
51
-
52
-
53
-
54
-
55
-
56
-
57
-
58
-
59
-
60
-
61
-
62
-
63
-
64
-
65
-
66
-
67
-
68
-
69
-
70
-
71
-
72
-
73
-
74
-
75
-
76
-
77
-
78
-
79
-
80
-
81
-
82
-
83
-
84
-
85
-
86
-
87
-
88
-
89
-
90
-
91
-
92
-
93
-
94
-
95
-
96
-
97
-
98
-
99
-
100
-
101
-
102
-
103
-
104
-
105
-
106
-
107
-
108
-
109
-
110
-
111
-
112
-
113
-
114
-
115
-
116
-
117
-
118
-
119
-
120
-
121
-
122
-
123
-
124
-
125
-
126
-
127
-
128
-
129
-
130
-
131
-
132
-
133
-
134
-
135
-
136
-
137
-
138
-
139
-
140
-
141
-
142
-
143
-
144
-
145
-
146
-
147
-
148
-
149
-
150
-
151
-
 152
152 -
 153
153 -
 154
154 -
 155
155 -
 156
156 -
 157
157 -
 158
158 -
 159
159 -
 160
160 -
 161
161 -
 162
162 -
 163
163 -
 164
164 -
 165
165 -
 166
166 -
 167
167 -
 168
168 -
 169
169 -
 170
170 -
 171
171 -
 172
172 -
173
-
174
-
175
-
176
-
177
-
178
-
179
-
180
-
181
-
182
-
183
-
184
-
185
-
186
-
187
-
188
-
189
-
190
-
191
-
192
-
193
-
194
-
195
-
196
-
197
-
198
-
199
-
200
-
201
-
202
-
203
-
204
-
205
-
206
-
207
-
208
-
209
-
210
-
211
-
212
-
213
-
214
-
215
-
216
-
217
-
218
-
219
-
220
-
221
-
222
-
223
-
224
-
225
-
226
-
227
-
228
-
229
-
230
-
231
-
232
-
233
-
234
-
235
-
236
-
237
-
238
-
239
-
240
-
241
-
242
-
243
-
244
-
245
-
246
-
247
-
248
-
249
-
250
-
251
-
252
-
253
-
254
-
255
-
256
-
257
-
258
-
259
-
260
-
261
-
262
-
263
-
264
-
265
-
266
-
267
-
268
-
269
-
270
-
271
-
272
-
273
-
274
-
275
-
276
-
277
-
278
-
279
-
280
-
281
-
282
-
283
-
284
-
285
-
286
-
287
-
288
-
289
-
290
-
291
-
292
-
293
-
294
-
295
-
296
-
297
-
298
-
299
-
300
-
301
-
302
-
303
-
304
-
305
-
306
-
307
-
308
-
309
-
310
-
311
-
312
-
313
-
314
-
315
-
316
-
317
-
318
-
319
-
320
-
321
-
322
-
323
-
324
-
325
-
326
-
327
-
328
-
329
-
330
-
331
-
332
-
333
-
334
-
335
-
336
-
337
-
338
-
339
-
340
-
341
-
342
-
343
-
344
-
345
-
346
-
347
-
348
-
349
-
350
-
351
-
352
-
353
-
354
-
355
-
356
-
357
-
358
-
359
-
360
-
361
-
362
-
363
-
364
-
365
-
366
-
367
-
368
-
369
-
370
-
371
-
372
-
373
-
374
 |
 |

161
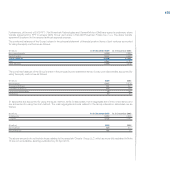
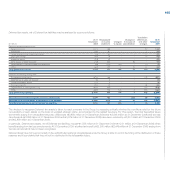
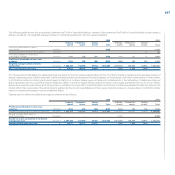
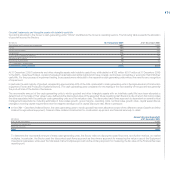
The detail of Other income (expenses) is as follows:
(€ million) 2009 2008
Gains on disposal of Property, plant and equipment 24 54
Royalties and other income from licences and know-how 63 32
Rental income 20 25
Recovery of expenses and compensation for damages 19 30
Release of excess provisions 146 94
Other income 186 170
Total Other income 458 405
Indirect taxes 149 152
Losses on disposal of Property, plant and equipment 21 19
Charges for other provisions 228 136
Other expenses 149 116
Total Other expenses 547 423
Other income (expenses) (89) (18)
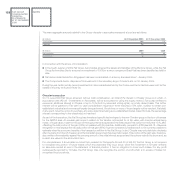
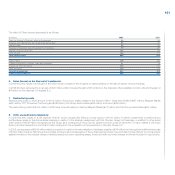
Gains (losses) on the disposal of investments6.
In 2009 this item results in a net gain of€4 million which consists of the net gains or losses realised on the sale of certain minority holdings.
In 2008 this item amounted to a net gain of€20 million which includes the gain of€14 million on the disposal of the subsidiary S.C.M. Ltda and the gain of
€4 million on the disposal of Targasys S.r.l.
Restructuring costs7.
Restructuring costs in 2009 amount to€312 million; this amount mainly relates to the Sectors CNH – Case New Holland (€87 million), Magneti Marelli
(€62 million), FPT Powertrain Technologies (€58 million), Fiat Group Automobiles (€54 million) and Iveco (€22 million).
The restructuring costs of€165 million in 2008 were incurred mainly by Sectors Magneti Marelli (€77 million) and Fiat Group Automobiles (€62 million).
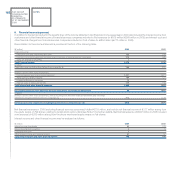
Other unusual income (expenses)8.
In 2009 this item results in a net expense of€391 which included the effects of write-downs of€104 million of certain investments in platforms and
architectures made by the Automobiles business in relation to the strategic realignment with the Chrysler Group LLC business, in addition to other asset
write-downs of€246 million recognized by the Group as a consequence of the current global economic crisis (of which€173 million relates to the Iveco
Sector) and the transaction costs of€41 million arising from the acquisition of the investment in Chrysler Group LLC.
In 2008, net expenses of€245 million mainly consisted of costs for the rationalisation of strategic suppliers (€74 million) and exceptional additional accruals
of€166 million made by Fiat Group Automobiles and Iveco as a consequence of the sudden serious crisis in the world automotive market, to provide mainly
against the risks of the residual values of vehicles leased out under operating leases, those sold with buy-back clauses and those included in used stocks.