Chrysler 2009 Annual Report Download - page 119
Download and view the complete annual report
Please find page 119 of the 2009 Chrysler annual report below. You can navigate through the pages in the report by either clicking on the pages listed below, or by using the keyword search tool below to find specific information within the annual report.-
 1
1 -
2
-
3
-
4
-
5
-
6
-
7
-
8
-
9
-
10
-
11
-
12
-
13
-
14
-
15
-
16
-
17
-
18
-
19
-
20
-
21
-
22
-
23
-
24
-
25
-
26
-
27
-
28
-
29
-
30
-
31
-
32
-
33
-
34
-
35
-
36
-
37
-
38
-
39
-
40
-
41
-
42
-
43
-
44
-
45
-
46
-
47
-
48
-
49
-
50
-
51
-
52
-
53
-
54
-
55
-
56
-
57
-
58
-
59
-
60
-
61
-
62
-
63
-
64
-
65
-
66
-
67
-
68
-
69
-
70
-
71
-
72
-
73
-
74
-
75
-
76
-
77
-
78
-
79
-
80
-
81
-
82
-
83
-
84
-
85
-
86
-
87
-
88
-
89
-
90
-
91
-
92
-
93
-
94
-
95
-
96
-
97
-
98
-
99
-
100
-
101
-
102
-
103
-
104
-
105
-
106
-
107
-
108
-
 109
109 -
 110
110 -
 111
111 -
 112
112 -
 113
113 -
 114
114 -
 115
115 -
 116
116 -
 117
117 -
 118
118 -
 119
119 -
 120
120 -
 121
121 -
 122
122 -
 123
123 -
 124
124 -
 125
125 -
 126
126 -
 127
127 -
 128
128 -
 129
129 -
130
-
131
-
132
-
133
-
134
-
135
-
136
-
137
-
138
-
139
-
140
-
141
-
142
-
143
-
144
-
145
-
146
-
147
-
148
-
149
-
150
-
151
-
152
-
153
-
154
-
155
-
156
-
157
-
158
-
159
-
160
-
161
-
162
-
163
-
164
-
165
-
166
-
167
-
168
-
169
-
170
-
171
-
172
-
173
-
174
-
175
-
176
-
177
-
178
-
179
-
180
-
181
-
182
-
183
-
184
-
185
-
186
-
187
-
188
-
189
-
190
-
191
-
192
-
193
-
194
-
195
-
196
-
197
-
198
-
199
-
200
-
201
-
202
-
203
-
204
-
205
-
206
-
207
-
208
-
209
-
210
-
211
-
212
-
213
-
214
-
215
-
216
-
217
-
218
-
219
-
220
-
221
-
222
-
223
-
224
-
225
-
226
-
227
-
228
-
229
-
230
-
231
-
232
-
233
-
234
-
235
-
236
-
237
-
238
-
239
-
240
-
241
-
242
-
243
-
244
-
245
-
246
-
247
-
248
-
249
-
250
-
251
-
252
-
253
-
254
-
255
-
256
-
257
-
258
-
259
-
260
-
261
-
262
-
263
-
264
-
265
-
266
-
267
-
268
-
269
-
270
-
271
-
272
-
273
-
274
-
275
-
276
-
277
-
278
-
279
-
280
-
281
-
282
-
283
-
284
-
285
-
286
-
287
-
288
-
289
-
290
-
291
-
292
-
293
-
294
-
295
-
296
-
297
-
298
-
299
-
300
-
301
-
302
-
303
-
304
-
305
-
306
-
307
-
308
-
309
-
310
-
311
-
312
-
313
-
314
-
315
-
316
-
317
-
318
-
319
-
320
-
321
-
322
-
323
-
324
-
325
-
326
-
327
-
328
-
329
-
330
-
331
-
332
-
333
-
334
-
335
-
336
-
337
-
338
-
339
-
340
-
341
-
342
-
343
-
344
-
345
-
346
-
347
-
348
-
349
-
350
-
351
-
352
-
353
-
354
-
355
-
356
-
357
-
358
-
359
-
360
-
361
-
362
-
363
-
364
-
365
-
366
-
367
-
368
-
369
-
370
-
371
-
372
-
373
-
374
 |
 |

REPORT ON
OPERATIONS
FINANCIAL
REVIEW -
FIAT S.P.A.
118
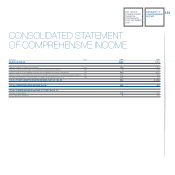
At 31 December 2009, equity totalled €12,487 million, a net increase of €317 million over 31 December 2008 principally reflecting profit for the period
(€340 million), net of dividends distributed on savings shares (€25 million).
A more detailed analysis of changes in equity is provided in Fiat S.p.A.’s financial statements.
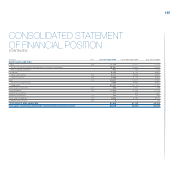
At 31 December 2009, net debt totalled €1,327 million. The €1,036 million decrease over 31 December 2008 was primarily attributable to an increase in
operating cash flow and decrease in working capital, net of the recapitalisation of subsidiaries referred to above. Net debt consisted of the following:
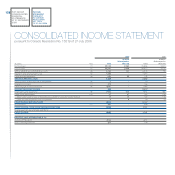
(E million)
At 31.12.2009 At 31.12.2008
Current financial assets, cash and cash equivalents (646) -
Current financial liabilities 157 553
Non-current financial liabilities 1,816 1,810
NET DEBT/(CASH) 1,327 2,363
At 31 December 2009, current financial assets essentially consisted of the current account balance held with the subsidiary Fiat Finance S.p.A.
On the same date, current financial liabilities primarily represented amounts payable to factoring companies for advances on receivables.
Non-current liabilities consisted almost entirely of loans from Fiat Finance S.p.A., at market rates of interest, which mature between 2010 and 2013.
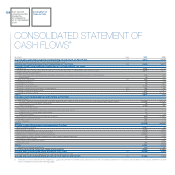
A more detailed analysis of cash flows is provided in Fiat S.p.A.’s financial statements.
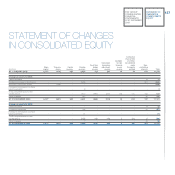
RECONCILIATION BETWEEN EQUITY AND NET PROFIT OF THE PARENT COMPANY AND THE GROUP
Pursuant to the requirements of the Consob Communication of 28 July 2006, the following table provides a reconciliation between net profit and equity of
Fiat S.p.A. for the year ended 31 December 2009 and the same values on a consolidated basis (attributable to owners of Fiat S.p.A.):
Equity at Net profit Equity at Net profit
(E million) 31.12.2009 2009 31.12.2008 2008
FINANCIAL STATEMENTS OF FIAT S.P.A. 12,487 340 12,170 1,199
Elimination of carrying amount of interests in consolidated entities and related dividends (13,969) (1,260) (14,426) (873)
Elimination of impairment losses (net of reversals) on consolidated entities - 858 - 7
Equity and profit/(loss) of consolidated entities 13,568 (784) 14,398 3,317
Consolidation adjustments:
Elimination of intercompany gains and losses on the disposal of investments - - - (7)
Elimination of the gain on disposal of the Fiat brand (879) - (879) (879)
Elimination of intercompany profits and losses on inventories and fixed assets,
dividends paid between subsidiaries and other adjustments (906) 8 (909) (1,152)
CONSOLIDATED FINANCIAL STATEMENTS (ATTRIBUTABLE TO OWNERS OF FIAT S.P.A.) 10,301 (838) 10,354 1,612