Chrysler 2009 Annual Report Download - page 301
Download and view the complete annual report
Please find page 301 of the 2009 Chrysler annual report below. You can navigate through the pages in the report by either clicking on the pages listed below, or by using the keyword search tool below to find specific information within the annual report.-
 1
1 -
2
-
3
-
4
-
5
-
6
-
7
-
8
-
9
-
10
-
11
-
12
-
13
-
14
-
15
-
16
-
17
-
18
-
19
-
20
-
21
-
22
-
23
-
24
-
25
-
26
-
27
-
28
-
29
-
30
-
31
-
32
-
33
-
34
-
35
-
36
-
37
-
38
-
39
-
40
-
41
-
42
-
43
-
44
-
45
-
46
-
47
-
48
-
49
-
50
-
51
-
52
-
53
-
54
-
55
-
56
-
57
-
58
-
59
-
60
-
61
-
62
-
63
-
64
-
65
-
66
-
67
-
68
-
69
-
70
-
71
-
72
-
73
-
74
-
75
-
76
-
77
-
78
-
79
-
80
-
81
-
82
-
83
-
84
-
85
-
86
-
87
-
88
-
89
-
90
-
91
-
92
-
93
-
94
-
95
-
96
-
97
-
98
-
99
-
100
-
101
-
102
-
103
-
104
-
105
-
106
-
107
-
108
-
109
-
110
-
111
-
112
-
113
-
114
-
115
-
116
-
117
-
118
-
119
-
120
-
121
-
122
-
123
-
124
-
125
-
126
-
127
-
128
-
129
-
130
-
131
-
132
-
133
-
134
-
135
-
136
-
137
-
138
-
139
-
140
-
141
-
142
-
143
-
144
-
145
-
146
-
147
-
148
-
149
-
150
-
151
-
152
-
153
-
154
-
155
-
156
-
157
-
158
-
159
-
160
-
161
-
162
-
163
-
164
-
165
-
166
-
167
-
168
-
169
-
170
-
171
-
172
-
173
-
174
-
175
-
176
-
177
-
178
-
179
-
180
-
181
-
182
-
183
-
184
-
185
-
186
-
187
-
188
-
189
-
190
-
191
-
192
-
193
-
194
-
195
-
196
-
197
-
198
-
199
-
200
-
201
-
202
-
203
-
204
-
205
-
206
-
207
-
208
-
209
-
210
-
211
-
212
-
213
-
214
-
215
-
216
-
217
-
218
-
219
-
220
-
221
-
222
-
223
-
224
-
225
-
226
-
227
-
228
-
229
-
230
-
231
-
232
-
233
-
234
-
235
-
236
-
237
-
238
-
239
-
240
-
241
-
242
-
243
-
244
-
245
-
246
-
247
-
248
-
249
-
250
-
251
-
252
-
253
-
254
-
255
-
256
-
257
-
258
-
259
-
260
-
261
-
262
-
263
-
264
-
265
-
266
-
267
-
268
-
269
-
270
-
271
-
272
-
273
-
274
-
275
-
276
-
277
-
278
-
279
-
280
-
281
-
282
-
283
-
284
-
285
-
286
-
287
-
288
-
289
-
290
-
 291
291 -
 292
292 -
 293
293 -
 294
294 -
 295
295 -
 296
296 -
 297
297 -
 298
298 -
 299
299 -
 300
300 -
 301
301 -
 302
302 -
 303
303 -
 304
304 -
 305
305 -
 306
306 -
 307
307 -
 308
308 -
 309
309 -
 310
310 -
 311
311 -
312
-
313
-
314
-
315
-
316
-
317
-
318
-
319
-
320
-
321
-
322
-
323
-
324
-
325
-
326
-
327
-
328
-
329
-
330
-
331
-
332
-
333
-
334
-
335
-
336
-
337
-
338
-
339
-
340
-
341
-
342
-
343
-
344
-
345
-
346
-
347
-
348
-
349
-
350
-
351
-
352
-
353
-
354
-
355
-
356
-
357
-
358
-
359
-
360
-
361
-
362
-
363
-
364
-
365
-
366
-
367
-
368
-
369
-
370
-
371
-
372
-
373
-
374
 |
 |

FIAT S.P.A.
STATUTORY
FINANCIAL
STATEMENTS AT
31 DECEMBER
2009
NOTES
300
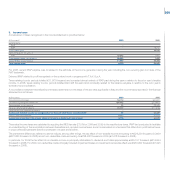
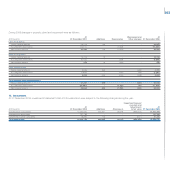
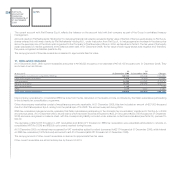
A breakdown of deferred tax liabilities, net of deferred tax assets, is provided in the following table.
At Recognised At
31 December in income Charged December
(€ thousand) 2008 statement to equity 2009
Deferred tax assets arising from:
Taxed provisions and other minor differences 9,531 (1,231) - 8,300
Total deferred tax assets 9,531 (1,231) - 8,300
Deferred tax liabilities arising from:
Measurement of construction contracts by the percentage completion method (42,105) 42,105 - -
Others (654) 232 - (422)
Total deferred tax liabilities (42,759) 42,337 - (422)
Theoretical tax benefit arising from tax loss carryforward 59,275 319,122 - 378,397
Adjustments for assets whose recoverability is not probable (31,905) (354,370) - (386,275)
Total deferred tax liabilities, net of deferred tax assets (5,858) 5,858 - -
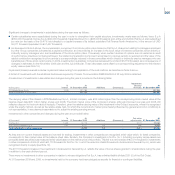
Deferred tax assets were determined through a critical analysis of the existence of the conditions for their future realisation, using updated strategic plans
and the related tax plans. As a consequence, the total theoretical future tax benefit arising from deductible temporary differences (€8,300 thousand at
31 December 2009 and €9,531 thousand at 31 December 2008) and tax loss carryforwards (€378,397 thousand at 31 December 2009 and €59,275
thousand at 31 December 2008) was reduced by €386,275 thousand at 31 December 2009 (€31,905 thousand at 31 December 2008).
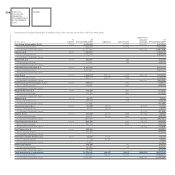
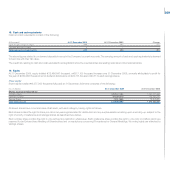
Total temporary differences (deductible and taxable) and total tax losses at 31 December 2009 and the amounts for which deferred tax assets have not been
recognised, broken down by year of expiry, are presented in the following table:
Year of expiry
Total at
31 December Beyond
(€ thousand)
2009 2010 2011 2012 2013 2013
Temporary differences and tax losses relating to IRES:
Deductible temporary differences 29,728 22,785 794 687 687 4,775
Taxable temporary differences (1,537) - - - - (1,537)
Tax losses 1,375,989 461,784 768,802 145,403 - -
Temporary differences and tax losses for which
deferred tax assets have not been recognised (1,404,180) (484,569) (769,596) (146,090) (687) (3,238)
Temporary differences and tax losses subject to national taxation - - - - - -
Temporary differences relating to IRAP:
Deductible temporary differences 2,606 2,505 101 - - -
Taxable temporary differences - - - - - -
Temporary differences and tax losses subject to local taxation 2,606 2,505 101 - - -