Chrysler 2009 Annual Report Download - page 167
Download and view the complete annual report
Please find page 167 of the 2009 Chrysler annual report below. You can navigate through the pages in the report by either clicking on the pages listed below, or by using the keyword search tool below to find specific information within the annual report.-
 1
1 -
2
-
3
-
4
-
5
-
6
-
7
-
8
-
9
-
10
-
11
-
12
-
13
-
14
-
15
-
16
-
17
-
18
-
19
-
20
-
21
-
22
-
23
-
24
-
25
-
26
-
27
-
28
-
29
-
30
-
31
-
32
-
33
-
34
-
35
-
36
-
37
-
38
-
39
-
40
-
41
-
42
-
43
-
44
-
45
-
46
-
47
-
48
-
49
-
50
-
51
-
52
-
53
-
54
-
55
-
56
-
57
-
58
-
59
-
60
-
61
-
62
-
63
-
64
-
65
-
66
-
67
-
68
-
69
-
70
-
71
-
72
-
73
-
74
-
75
-
76
-
77
-
78
-
79
-
80
-
81
-
82
-
83
-
84
-
85
-
86
-
87
-
88
-
89
-
90
-
91
-
92
-
93
-
94
-
95
-
96
-
97
-
98
-
99
-
100
-
101
-
102
-
103
-
104
-
105
-
106
-
107
-
108
-
109
-
110
-
111
-
112
-
113
-
114
-
115
-
116
-
117
-
118
-
119
-
120
-
121
-
122
-
123
-
124
-
125
-
126
-
127
-
128
-
129
-
130
-
131
-
132
-
133
-
134
-
135
-
136
-
137
-
138
-
139
-
140
-
141
-
142
-
143
-
144
-
145
-
146
-
147
-
148
-
149
-
150
-
151
-
152
-
153
-
154
-
155
-
156
-
 157
157 -
 158
158 -
 159
159 -
 160
160 -
 161
161 -
 162
162 -
 163
163 -
 164
164 -
 165
165 -
 166
166 -
 167
167 -
 168
168 -
 169
169 -
 170
170 -
 171
171 -
 172
172 -
 173
173 -
 174
174 -
 175
175 -
 176
176 -
 177
177 -
178
-
179
-
180
-
181
-
182
-
183
-
184
-
185
-
186
-
187
-
188
-
189
-
190
-
191
-
192
-
193
-
194
-
195
-
196
-
197
-
198
-
199
-
200
-
201
-
202
-
203
-
204
-
205
-
206
-
207
-
208
-
209
-
210
-
211
-
212
-
213
-
214
-
215
-
216
-
217
-
218
-
219
-
220
-
221
-
222
-
223
-
224
-
225
-
226
-
227
-
228
-
229
-
230
-
231
-
232
-
233
-
234
-
235
-
236
-
237
-
238
-
239
-
240
-
241
-
242
-
243
-
244
-
245
-
246
-
247
-
248
-
249
-
250
-
251
-
252
-
253
-
254
-
255
-
256
-
257
-
258
-
259
-
260
-
261
-
262
-
263
-
264
-
265
-
266
-
267
-
268
-
269
-
270
-
271
-
272
-
273
-
274
-
275
-
276
-
277
-
278
-
279
-
280
-
281
-
282
-
283
-
284
-
285
-
286
-
287
-
288
-
289
-
290
-
291
-
292
-
293
-
294
-
295
-
296
-
297
-
298
-
299
-
300
-
301
-
302
-
303
-
304
-
305
-
306
-
307
-
308
-
309
-
310
-
311
-
312
-
313
-
314
-
315
-
316
-
317
-
318
-
319
-
320
-
321
-
322
-
323
-
324
-
325
-
326
-
327
-
328
-
329
-
330
-
331
-
332
-
333
-
334
-
335
-
336
-
337
-
338
-
339
-
340
-
341
-
342
-
343
-
344
-
345
-
346
-
347
-
348
-
349
-
350
-
351
-
352
-
353
-
354
-
355
-
356
-
357
-
358
-
359
-
360
-
361
-
362
-
363
-
364
-
365
-
366
-
367
-
368
-
369
-
370
-
371
-
372
-
373
-
374
 |
 |

166 FIAT GROUP
CONSOLIDATED
FINANCIAL
STATEMENTS
AT 31 DECEMBER
2009
NOTES
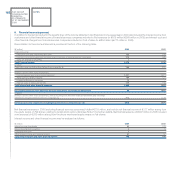
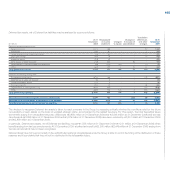
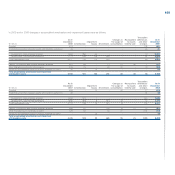
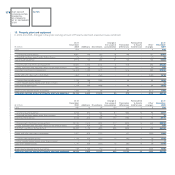
The totals of deductible and taxable temporary differences and accumulated tax losses at 31 December 2009, together with the amounts for which deferred
tax assets have not been recognised, analysed by year of expiry, are as follows:
Year of expiry
Total at Unlimited/
31 December Beyond indetermi-
(€ million) 2009 2010 2011 2012 2013 2013 nable
Temporary differences and tax losses relating to state taxation
(IRES in the case of Italy):
Deductible temporary differences 13,192 3,393 1,687 1,734 1,650 4,593 135
Taxable temporary differences (7,652) (2,806) (1,152) (1,064) (936) (1,677) (17)
Tax losses 13,626 1,855 1,259 352 212 2,429 7,519
Temporary differences and tax losses for which deferred tax
assets have not been recognised (11,465) (2,608) (1,303) (306) (310) (2,238) (4,700)
Temporary differences and tax losses relating to State taxation 7,701 (166) 491 716 616 3,107 2,937
Temporary differences and tax losses relating to local taxation
(IRAP in the case of Italy):
Deductible temporary differences 5,549 1,412 662 651 567 2,219 38
Taxable temporary differences (3,954) (950) (773) (652) (541) (958) (80)
Tax losses 1,070 15 15 16 - 185 839
Temporary differences and tax losses for which deferred tax assets
have not been recognised (1,049) (55) (16) (2) 3 (420) (559)
Temporary differences and tax losses relating to local taxation 1,616 422 (112) 13 29 1,026 238
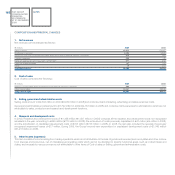
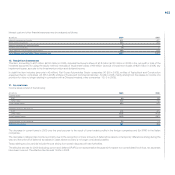
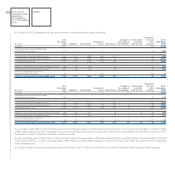
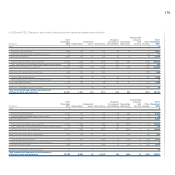
Other information by nature12.
The income statement includes personnel costs for€6,810 million in 2009 (€7,466 million in 2008).
An analysis of the average number of employees by category is provided as follows:
2009 2008
Managers 2,333 2,442
White-collar 57,805 57,693
Blue-collar 130,513 138,005
Average number of employees 190,651 198,140
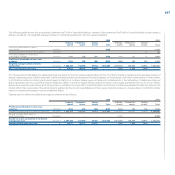
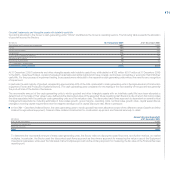
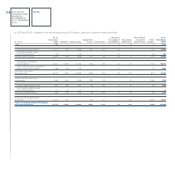
Earnings/(loss) per share13.
As explained in Note 24 below, Fiat S.p.A. share capital is represented by three different classes of shares (ordinary shares, preference shares and saving
shares) that participate in dividends with different rights. Profit or loss of the period attributable to each class of share is determined in accordance with the
share’s contractual dividend rights. For this purpose, in 2009 the loss attributable to the owners of the parent was allocated to all three classes of share. In
2008, the Profit attributable to owners of the parent entity is adjusted by the amount of the preference dividends attributable to saving shares declared in
the period equal to€0.31 per share. In order to determine earnings per share, the amount obtained has been divided by the weighted average number of
outstanding shares.