Chrysler 2009 Annual Report Download - page 64
Download and view the complete annual report
Please find page 64 of the 2009 Chrysler annual report below. You can navigate through the pages in the report by either clicking on the pages listed below, or by using the keyword search tool below to find specific information within the annual report.-
 1
1 -
2
-
3
-
4
-
5
-
6
-
7
-
8
-
9
-
10
-
11
-
12
-
13
-
14
-
15
-
16
-
17
-
18
-
19
-
20
-
21
-
22
-
23
-
24
-
25
-
26
-
27
-
28
-
29
-
30
-
31
-
32
-
33
-
34
-
35
-
36
-
37
-
38
-
39
-
40
-
41
-
42
-
43
-
44
-
45
-
46
-
47
-
48
-
49
-
50
-
51
-
52
-
53
-
 54
54 -
 55
55 -
 56
56 -
 57
57 -
 58
58 -
 59
59 -
 60
60 -
 61
61 -
 62
62 -
 63
63 -
 64
64 -
 65
65 -
 66
66 -
 67
67 -
 68
68 -
 69
69 -
 70
70 -
 71
71 -
 72
72 -
 73
73 -
 74
74 -
75
-
76
-
77
-
78
-
79
-
80
-
81
-
82
-
83
-
84
-
85
-
86
-
87
-
88
-
89
-
90
-
91
-
92
-
93
-
94
-
95
-
96
-
97
-
98
-
99
-
100
-
101
-
102
-
103
-
104
-
105
-
106
-
107
-
108
-
109
-
110
-
111
-
112
-
113
-
114
-
115
-
116
-
117
-
118
-
119
-
120
-
121
-
122
-
123
-
124
-
125
-
126
-
127
-
128
-
129
-
130
-
131
-
132
-
133
-
134
-
135
-
136
-
137
-
138
-
139
-
140
-
141
-
142
-
143
-
144
-
145
-
146
-
147
-
148
-
149
-
150
-
151
-
152
-
153
-
154
-
155
-
156
-
157
-
158
-
159
-
160
-
161
-
162
-
163
-
164
-
165
-
166
-
167
-
168
-
169
-
170
-
171
-
172
-
173
-
174
-
175
-
176
-
177
-
178
-
179
-
180
-
181
-
182
-
183
-
184
-
185
-
186
-
187
-
188
-
189
-
190
-
191
-
192
-
193
-
194
-
195
-
196
-
197
-
198
-
199
-
200
-
201
-
202
-
203
-
204
-
205
-
206
-
207
-
208
-
209
-
210
-
211
-
212
-
213
-
214
-
215
-
216
-
217
-
218
-
219
-
220
-
221
-
222
-
223
-
224
-
225
-
226
-
227
-
228
-
229
-
230
-
231
-
232
-
233
-
234
-
235
-
236
-
237
-
238
-
239
-
240
-
241
-
242
-
243
-
244
-
245
-
246
-
247
-
248
-
249
-
250
-
251
-
252
-
253
-
254
-
255
-
256
-
257
-
258
-
259
-
260
-
261
-
262
-
263
-
264
-
265
-
266
-
267
-
268
-
269
-
270
-
271
-
272
-
273
-
274
-
275
-
276
-
277
-
278
-
279
-
280
-
281
-
282
-
283
-
284
-
285
-
286
-
287
-
288
-
289
-
290
-
291
-
292
-
293
-
294
-
295
-
296
-
297
-
298
-
299
-
300
-
301
-
302
-
303
-
304
-
305
-
306
-
307
-
308
-
309
-
310
-
311
-
312
-
313
-
314
-
315
-
316
-
317
-
318
-
319
-
320
-
321
-
322
-
323
-
324
-
325
-
326
-
327
-
328
-
329
-
330
-
331
-
332
-
333
-
334
-
335
-
336
-
337
-
338
-
339
-
340
-
341
-
342
-
343
-
344
-
345
-
346
-
347
-
348
-
349
-
350
-
351
-
352
-
353
-
354
-
355
-
356
-
357
-
358
-
359
-
360
-
361
-
362
-
363
-
364
-
365
-
366
-
367
-
368
-
369
-
370
-
371
-
372
-
373
-
374
 |
 |

63
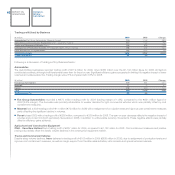
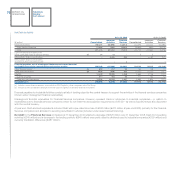
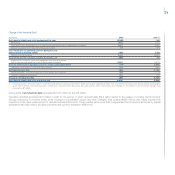
Consolidated Statement of Cash Flows
Following is a summary statement of cash flows and related comments. A full statement of cash flows is provided in the consolidated financial
statements.
(€ million)
2009 2008 (*)
A) CASH AND CASH EQUIVALENTS AT BEGINNING OF THE YEAR (AS REPORTED) 3,683 6,639
Cash and cash equivalents included under Assets held for sale - 2
B) CASH AND CASH EQUIVALENTS AT BEGINNING OF THE YEAR 3,683 6,641
C) CASH FROM/(USED IN) OPERATING ACTIVITIES DURING THE YEAR 4,601 166
D) CASH FROM/(USED IN) INVESTING ACTIVITIES (2,559) (6,092)
E) CASH FROM/(USED IN) FINANCING ACTIVITIES 6,281 3,127
Currency translation differences 220 (159)
F) NET CHANGE IN CASH AND CASH EQUIVALENTS 8,543 (2,958)
G) CASH AND CASH EQUIVALENTS AT END OF THE YEAR 12,226 3,683
of which: Cash and cash equivalents included under Assets held for sale - -
H) CASH AND CASH EQUIVALENTS AT END OF THE YEAR (AS REPORTED) 12,226 3,683
(*) Following adoption of the improvement to IAS 16 in 2009, as described in the Notes to the Consolidated Financial Statements, the amount for “Cash from operating activities” reported in the 2008
Consolidated Financial Statements was reduced by €218 million and “Cash used in investing activities” was reduced by the same amount.
In 2009, €4,601 million in cash was generated from operating activities, consisting of a €2.6 billion decrease in working capital (calculated on a
comparable scope of operations and at constant exchange rates) and €2 billion in income-related cash inflows (i.e., net profit plus amortisation and
depreciation, dividends, changes in provisions and various items related to sales with buy-back commitments and operating leases, net of “Gains/losses
on disposal and Other non-cash items”).
Cash used in investing activities totalled €2,559 million.
Expenditure for tangible and intangible assets (including €1,046 million in capitalised development costs) totalled €3,386 million.
Investments in subsidiaries and associates totalled €105 million and included the recapitalisation of the 50/50 joint venture Fiat India Automobiles Private
Limited (€48 million).
For 2009, proceeds from the sale of non-current assets totalled €108 million and related to both tangible and intangible assets.
The €882 million decrease in receivables from financing activities was primarily attributable to the reduction in financing provided by the financial services
companies of CNH - Case New Holland as a result of lower business volumes.
Approximately €6.3 billion was generated by financing activities, primarily from bonds issued by Fiat Finance and Trade Ltd SA (€4.2 billion) and Case
New Holland Inc. (USD 1 billion, equivalent to approximately €0.7 billion), in addition to net new medium-term financing – including utilisation of a new
€1 billion, 3-year syndicated credit facility and a €400 million term loan provided by the European Investment Bank – totalling €1.8 billion. During 2009,
approximately €0.5 billion in bonds were repaid at maturity.