Chrysler 2009 Annual Report Download - page 298
Download and view the complete annual report
Please find page 298 of the 2009 Chrysler annual report below. You can navigate through the pages in the report by either clicking on the pages listed below, or by using the keyword search tool below to find specific information within the annual report.-
 1
1 -
2
-
3
-
4
-
5
-
6
-
7
-
8
-
9
-
10
-
11
-
12
-
13
-
14
-
15
-
16
-
17
-
18
-
19
-
20
-
21
-
22
-
23
-
24
-
25
-
26
-
27
-
28
-
29
-
30
-
31
-
32
-
33
-
34
-
35
-
36
-
37
-
38
-
39
-
40
-
41
-
42
-
43
-
44
-
45
-
46
-
47
-
48
-
49
-
50
-
51
-
52
-
53
-
54
-
55
-
56
-
57
-
58
-
59
-
60
-
61
-
62
-
63
-
64
-
65
-
66
-
67
-
68
-
69
-
70
-
71
-
72
-
73
-
74
-
75
-
76
-
77
-
78
-
79
-
80
-
81
-
82
-
83
-
84
-
85
-
86
-
87
-
88
-
89
-
90
-
91
-
92
-
93
-
94
-
95
-
96
-
97
-
98
-
99
-
100
-
101
-
102
-
103
-
104
-
105
-
106
-
107
-
108
-
109
-
110
-
111
-
112
-
113
-
114
-
115
-
116
-
117
-
118
-
119
-
120
-
121
-
122
-
123
-
124
-
125
-
126
-
127
-
128
-
129
-
130
-
131
-
132
-
133
-
134
-
135
-
136
-
137
-
138
-
139
-
140
-
141
-
142
-
143
-
144
-
145
-
146
-
147
-
148
-
149
-
150
-
151
-
152
-
153
-
154
-
155
-
156
-
157
-
158
-
159
-
160
-
161
-
162
-
163
-
164
-
165
-
166
-
167
-
168
-
169
-
170
-
171
-
172
-
173
-
174
-
175
-
176
-
177
-
178
-
179
-
180
-
181
-
182
-
183
-
184
-
185
-
186
-
187
-
188
-
189
-
190
-
191
-
192
-
193
-
194
-
195
-
196
-
197
-
198
-
199
-
200
-
201
-
202
-
203
-
204
-
205
-
206
-
207
-
208
-
209
-
210
-
211
-
212
-
213
-
214
-
215
-
216
-
217
-
218
-
219
-
220
-
221
-
222
-
223
-
224
-
225
-
226
-
227
-
228
-
229
-
230
-
231
-
232
-
233
-
234
-
235
-
236
-
237
-
238
-
239
-
240
-
241
-
242
-
243
-
244
-
245
-
246
-
247
-
248
-
249
-
250
-
251
-
252
-
253
-
254
-
255
-
256
-
257
-
258
-
259
-
260
-
261
-
262
-
263
-
264
-
265
-
266
-
267
-
268
-
269
-
270
-
271
-
272
-
273
-
274
-
275
-
276
-
277
-
278
-
279
-
280
-
281
-
282
-
283
-
284
-
285
-
286
-
287
-
 288
288 -
 289
289 -
 290
290 -
 291
291 -
 292
292 -
 293
293 -
 294
294 -
 295
295 -
 296
296 -
 297
297 -
 298
298 -
 299
299 -
 300
300 -
 301
301 -
 302
302 -
 303
303 -
 304
304 -
 305
305 -
 306
306 -
 307
307 -
 308
308 -
309
-
310
-
311
-
312
-
313
-
314
-
315
-
316
-
317
-
318
-
319
-
320
-
321
-
322
-
323
-
324
-
325
-
326
-
327
-
328
-
329
-
330
-
331
-
332
-
333
-
334
-
335
-
336
-
337
-
338
-
339
-
340
-
341
-
342
-
343
-
344
-
345
-
346
-
347
-
348
-
349
-
350
-
351
-
352
-
353
-
354
-
355
-
356
-
357
-
358
-
359
-
360
-
361
-
362
-
363
-
364
-
365
-
366
-
367
-
368
-
369
-
370
-
371
-
372
-
373
-
374
 |
 |

297
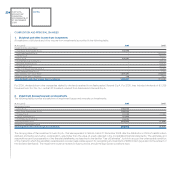
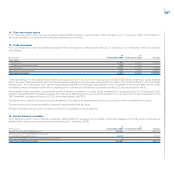
6. Other operating costs
A breakdown of other operating costs is provided in the following table:
(€ thousand) 2009 2008
Costs for services rendered by Group companies 25,352 32,017
Costs for services rendered by third parties 39,592 61,158
Compensation component from stock option plans 8,154 7,676
Leases and rentals 3,685 3,245
Purchase of goods 734 960
Depreciation of property, plant and equipment 1,644 1,752
Amortisation of intangible assets 62 110
Misc. operating costs 6,682 7,515
Total other operating costs 85,905 114,433
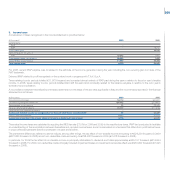
Costs for services rendered by Group companies primarily consisted of assistance and consultancy of an administrative and financial nature, public relations,
payroll services, security services and internal audit services (see Note 30).
Costs for services rendered by third parties principally included technical (the high speed train T.A.V.) legal, administrative and financial services and IT
services. The decrease over 2008 was due to cost reduction measures implemented, the absence of costs for the enhancement and management of the
Fiat brand, as well as a reduction in technical advisory fees as activity related to contracts with T.A.V. S.p.A. approaches completion. Costs for services
also include fees paid to the directors and statutory auditors of Fiat S.p.A. amounting to €7,220 thousand and €152 thousand respectively. The amount
of directors’ fees includes fees resolved by shareholders as well as compensation established by the Board of Directors for directors vested with specific
responsibilities.
The compensation component from stock option plans is connected with the options granted to the Chief Executive Officer and is represented by the
notional cost, with the offsetting credit recognised directly in the relevant equity reserve (see Note 19).
Miscellaneous operating costs consist of subscriptions to trade associations, indirect taxes and duties (local taxes on real estate properties, non-deductible
VAT, etc.), prior year expenses and other minor costs.
7. Gains/(losses) from non-recurring transactions
There were no gains or losses from non-recurring transactions for 2009. For 2008, there was a gain of €879,483 thousand which consisted of the net gain
from the transfer of the FIAT trademark to the indirect subsidiary Fiat Group Marketing & Corporate Communication S.p.A., which is responsible for brand
management. Consideration for the transfer of €880 million was based on a valuation conducted by a leading independent advisor, using internationally
accepted valuation methodologies.
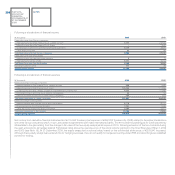
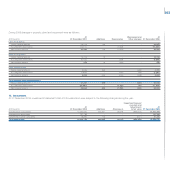
8. Financial income/(expense)
Following is a breakdown of financial income/(expense):
(€ thousand) 2009 2008
Financial income 14,190 43,696
Financial expense (144,873) (202,539)
Net income/(expense) from derivative financial instruments 116,992 (262,832)
Total financial income/(expense) (13,691) (421,675)