Chrysler 2009 Annual Report Download - page 33
Download and view the complete annual report
Please find page 33 of the 2009 Chrysler annual report below. You can navigate through the pages in the report by either clicking on the pages listed below, or by using the keyword search tool below to find specific information within the annual report.-
 1
1 -
2
-
3
-
4
-
5
-
6
-
7
-
8
-
9
-
10
-
11
-
12
-
13
-
14
-
15
-
16
-
17
-
18
-
19
-
20
-
21
-
22
-
 23
23 -
 24
24 -
 25
25 -
 26
26 -
 27
27 -
 28
28 -
 29
29 -
 30
30 -
 31
31 -
 32
32 -
 33
33 -
 34
34 -
 35
35 -
 36
36 -
 37
37 -
 38
38 -
 39
39 -
 40
40 -
 41
41 -
 42
42 -
 43
43 -
44
-
45
-
46
-
47
-
48
-
49
-
50
-
51
-
52
-
53
-
54
-
55
-
56
-
57
-
58
-
59
-
60
-
61
-
62
-
63
-
64
-
65
-
66
-
67
-
68
-
69
-
70
-
71
-
72
-
73
-
74
-
75
-
76
-
77
-
78
-
79
-
80
-
81
-
82
-
83
-
84
-
85
-
86
-
87
-
88
-
89
-
90
-
91
-
92
-
93
-
94
-
95
-
96
-
97
-
98
-
99
-
100
-
101
-
102
-
103
-
104
-
105
-
106
-
107
-
108
-
109
-
110
-
111
-
112
-
113
-
114
-
115
-
116
-
117
-
118
-
119
-
120
-
121
-
122
-
123
-
124
-
125
-
126
-
127
-
128
-
129
-
130
-
131
-
132
-
133
-
134
-
135
-
136
-
137
-
138
-
139
-
140
-
141
-
142
-
143
-
144
-
145
-
146
-
147
-
148
-
149
-
150
-
151
-
152
-
153
-
154
-
155
-
156
-
157
-
158
-
159
-
160
-
161
-
162
-
163
-
164
-
165
-
166
-
167
-
168
-
169
-
170
-
171
-
172
-
173
-
174
-
175
-
176
-
177
-
178
-
179
-
180
-
181
-
182
-
183
-
184
-
185
-
186
-
187
-
188
-
189
-
190
-
191
-
192
-
193
-
194
-
195
-
196
-
197
-
198
-
199
-
200
-
201
-
202
-
203
-
204
-
205
-
206
-
207
-
208
-
209
-
210
-
211
-
212
-
213
-
214
-
215
-
216
-
217
-
218
-
219
-
220
-
221
-
222
-
223
-
224
-
225
-
226
-
227
-
228
-
229
-
230
-
231
-
232
-
233
-
234
-
235
-
236
-
237
-
238
-
239
-
240
-
241
-
242
-
243
-
244
-
245
-
246
-
247
-
248
-
249
-
250
-
251
-
252
-
253
-
254
-
255
-
256
-
257
-
258
-
259
-
260
-
261
-
262
-
263
-
264
-
265
-
266
-
267
-
268
-
269
-
270
-
271
-
272
-
273
-
274
-
275
-
276
-
277
-
278
-
279
-
280
-
281
-
282
-
283
-
284
-
285
-
286
-
287
-
288
-
289
-
290
-
291
-
292
-
293
-
294
-
295
-
296
-
297
-
298
-
299
-
300
-
301
-
302
-
303
-
304
-
305
-
306
-
307
-
308
-
309
-
310
-
311
-
312
-
313
-
314
-
315
-
316
-
317
-
318
-
319
-
320
-
321
-
322
-
323
-
324
-
325
-
326
-
327
-
328
-
329
-
330
-
331
-
332
-
333
-
334
-
335
-
336
-
337
-
338
-
339
-
340
-
341
-
342
-
343
-
344
-
345
-
346
-
347
-
348
-
349
-
350
-
351
-
352
-
353
-
354
-
355
-
356
-
357
-
358
-
359
-
360
-
361
-
362
-
363
-
364
-
365
-
366
-
367
-
368
-
369
-
370
-
371
-
372
-
373
-
374
 |
 |

REPORT ON
OPERATIONS
SHAREHOLDERS
32
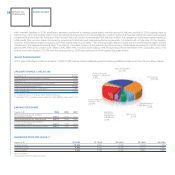
Exor S.p.A.(*)
30.5%
Capital Research
& Management Co.
5.2%
FMR LLC (**)
5.0%
Other shareholders
25.4%
Other institutional
investors - outside EU
4.8%
Other institutional
investors - EU
22.6%
BlackRock
Investment
Management
(UK) Limited
3.0%
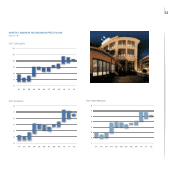
After dramatic declines in 2008, pessimistic sentiment continued to depress global equity markets during the first two months of 2009 pushing them to
historic lows. Hit by the liquidity crisis in the international banking system, and several failures, investors feared that financial institutions which had received
considerable government aid to support them through the crisis could be nationalised. But financial markets then staged an unexpected uptick based on
initial results from recovery plans introduced by governments and improved business performance generally. Confidence did not fully return to the markets,
however, and investors looked forward to 2010 with a great deal of uncertainty. Fear of a large-scale default in Dubai at the end of November again created
turbulence in the markets for several days. The majority of markets closed out the year with a partial recovery of the losses experienced in 2008: Frankfurt
gained 24%, Paris 22%, London 22%, Madrid 30%, Milan 19%, the Dow Jones was up 19%, Hong Kong 52% and the Nikkei 19%. During this period, Fiat
shares more than doubled (+123%) over the closing price for 2008 (best performer in 2009 against European peers).
MAJOR SHAREHOLDERS
At the date of this Report, Fiat had a total of 1,092,247,485 ordinary shares outstanding and the following institutions held more than 2% of ordinary shares:
(figures in E) 31.12.09 31.12.08 28.12.07 29.12.06 30.12.05
Ordinary shares 10.250 4.590 17.695 14.468 7.360
Preference shares 6.000 2.440 14.640 12.119 5.930
Savings shares 6.295 3.035 14.655 13.880 6.584
(Source: Reuters)
(*) Equivalent to the closing auction price.
(figures in E) 2009 2008 2007
Basic earnings/(loss) per ordinary
and preference share (0.677) 1.290 1.537
Basic earnings/(loss) per savings share (0.677) 1.445 1.692
Diluted earnings/(loss) per ordinary
and preference share (0.677) 1.285 1.526
Diluted earnings/(loss) per savings share (0.677) 1.440 1.681
Exor S.p.A. (*) 30.5%
Capital Research & Management Company 5.2%
FMR LLC (**) 5.0%
BlackRock Investment Management (UK) Limited 3.0%
Other institutional investors - EU 22.6%
Other institutional investors - outside EU 4.8%
Other shareholders 25.4%
(*) In addition to 3.5% of ordinary shares held by Fiat S.p.A.
(**) Including 1.75% of ordinary shares in relation to which FMR has sole power to vote.
REFERENCE PRICE PER SHARE (*):
EARNINGS PER SHARE
ORDINARY SHARES: 1,092,247,485