Chrysler 2009 Annual Report Download - page 216
Download and view the complete annual report
Please find page 216 of the 2009 Chrysler annual report below. You can navigate through the pages in the report by either clicking on the pages listed below, or by using the keyword search tool below to find specific information within the annual report.-
 1
1 -
2
-
3
-
4
-
5
-
6
-
7
-
8
-
9
-
10
-
11
-
12
-
13
-
14
-
15
-
16
-
17
-
18
-
19
-
20
-
21
-
22
-
23
-
24
-
25
-
26
-
27
-
28
-
29
-
30
-
31
-
32
-
33
-
34
-
35
-
36
-
37
-
38
-
39
-
40
-
41
-
42
-
43
-
44
-
45
-
46
-
47
-
48
-
49
-
50
-
51
-
52
-
53
-
54
-
55
-
56
-
57
-
58
-
59
-
60
-
61
-
62
-
63
-
64
-
65
-
66
-
67
-
68
-
69
-
70
-
71
-
72
-
73
-
74
-
75
-
76
-
77
-
78
-
79
-
80
-
81
-
82
-
83
-
84
-
85
-
86
-
87
-
88
-
89
-
90
-
91
-
92
-
93
-
94
-
95
-
96
-
97
-
98
-
99
-
100
-
101
-
102
-
103
-
104
-
105
-
106
-
107
-
108
-
109
-
110
-
111
-
112
-
113
-
114
-
115
-
116
-
117
-
118
-
119
-
120
-
121
-
122
-
123
-
124
-
125
-
126
-
127
-
128
-
129
-
130
-
131
-
132
-
133
-
134
-
135
-
136
-
137
-
138
-
139
-
140
-
141
-
142
-
143
-
144
-
145
-
146
-
147
-
148
-
149
-
150
-
151
-
152
-
153
-
154
-
155
-
156
-
157
-
158
-
159
-
160
-
161
-
162
-
163
-
164
-
165
-
166
-
167
-
168
-
169
-
170
-
171
-
172
-
173
-
174
-
175
-
176
-
177
-
178
-
179
-
180
-
181
-
182
-
183
-
184
-
185
-
186
-
187
-
188
-
189
-
190
-
191
-
192
-
193
-
194
-
195
-
196
-
197
-
198
-
199
-
200
-
201
-
202
-
203
-
204
-
205
-
 206
206 -
 207
207 -
 208
208 -
 209
209 -
 210
210 -
 211
211 -
 212
212 -
 213
213 -
 214
214 -
 215
215 -
 216
216 -
 217
217 -
 218
218 -
 219
219 -
 220
220 -
 221
221 -
 222
222 -
 223
223 -
 224
224 -
 225
225 -
 226
226 -
227
-
228
-
229
-
230
-
231
-
232
-
233
-
234
-
235
-
236
-
237
-
238
-
239
-
240
-
241
-
242
-
243
-
244
-
245
-
246
-
247
-
248
-
249
-
250
-
251
-
252
-
253
-
254
-
255
-
256
-
257
-
258
-
259
-
260
-
261
-
262
-
263
-
264
-
265
-
266
-
267
-
268
-
269
-
270
-
271
-
272
-
273
-
274
-
275
-
276
-
277
-
278
-
279
-
280
-
281
-
282
-
283
-
284
-
285
-
286
-
287
-
288
-
289
-
290
-
291
-
292
-
293
-
294
-
295
-
296
-
297
-
298
-
299
-
300
-
301
-
302
-
303
-
304
-
305
-
306
-
307
-
308
-
309
-
310
-
311
-
312
-
313
-
314
-
315
-
316
-
317
-
318
-
319
-
320
-
321
-
322
-
323
-
324
-
325
-
326
-
327
-
328
-
329
-
330
-
331
-
332
-
333
-
334
-
335
-
336
-
337
-
338
-
339
-
340
-
341
-
342
-
343
-
344
-
345
-
346
-
347
-
348
-
349
-
350
-
351
-
352
-
353
-
354
-
355
-
356
-
357
-
358
-
359
-
360
-
361
-
362
-
363
-
364
-
365
-
366
-
367
-
368
-
369
-
370
-
371
-
372
-
373
-
374
 |
 |

215
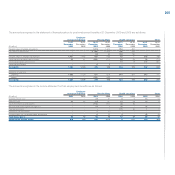
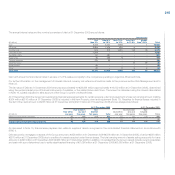
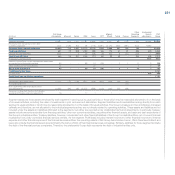
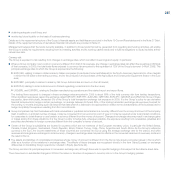
The annual interest rates and the nominal currencies of debt at 31 December 2009 are as follows:
Interest rate
less from 5% from 7.5% from 10% greater
(€ million) than 5% to 7.5% to 10% to 12.5% than 12.5% Total
Euro 6,246 8,141 2,500 - 1 16,888
US dollar 3,964 1,378 694 6 - 6,042
Brazilian real 374 315 2,481 148 55 3,373
Canadian dollar 1,242 - - - - 1,242
Australian dollar 61 501 - - - 562
Polish zloty 45 105 9 - - 159
Chinese renminbi 113 32 - - - 145
Argentine peso - - - 16 20 36
British pound 26 - - - - 26
Other 40 - 9 3 2 54
Total Debt 12,111 10,472 5,693 173 78 28,527
Debt with annual nominal interest rates in excess of 12.5% relates principally to the companies operating in Argentina, Brazil and India.
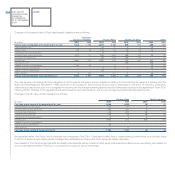
For further information on the management of interest rate and currency risk reference should be made to the previous section Risk Management and to
Note 33.
The fair value of Debt at 31 December 2009 amounts approximately to €28,844 million (approximately €19,932 million at 31 December 2008), determined
using the quoted market price of financial instruments, if available, or the related future cash flows. The amount is calculated using the interest rates stated
in Note 19, suitably adjusted to take account of the Group’s current creditworthiness.
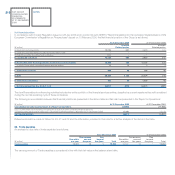
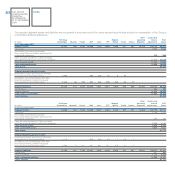
At 31 December 2009 the Group had outstanding financial lease agreements for certain property, plant and equipment whose net carrying amount totalling
€304 million (€310 million at 31 December 2008) is included in the item Property, plant and equipment (Note 15). Payables for finance leases included in
the item Other debt amount to €268 million at 31 December 2009 (€276 million at 31 December 2008) and are analysed as follows:
At 31 December 2009 At 31 December 2008
Due between Due Due between Due
Due within one and beyond Due within one and beyond
(€ million) one year five years five years Total one year five years five years Total
Minimum future lease payments 47 105 119 271 55 116 109 280
Interest expense (1) (2) - (3) (2) (2) - (4)
Present value of minimum lease payments 46 103 119 268 53 114 109 276
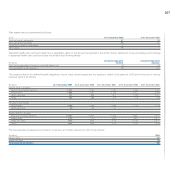
As discussed in Note 15, finance lease payables also relate to suppliers’ assets recognised in the consolidated financial statements in accordance with
IFRIC 4.
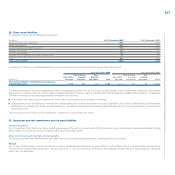
Debt secured by mortgages on assets of the Group amounts to €358 million at 31 December 2009 (€378 million at 31 December 2008), of which €268 million
(€276 million at 31 December 2008) due to creditors for assets acquired under finance leases. The total carrying amount of assets acting as security for loans
amounts to €446 million at 31 December 2009 (€466 million at 31 December 2008). In addition, it is recalled that the Group’s assets include current receivables
and cash with a pre-determined use to settle asset-backed financing of €7,086 million at 31 December 2009 (€6,663 million at 31 December 2008).