Chrysler 2009 Annual Report Download - page 183
Download and view the complete annual report
Please find page 183 of the 2009 Chrysler annual report below. You can navigate through the pages in the report by either clicking on the pages listed below, or by using the keyword search tool below to find specific information within the annual report.-
 1
1 -
2
-
3
-
4
-
5
-
6
-
7
-
8
-
9
-
10
-
11
-
12
-
13
-
14
-
15
-
16
-
17
-
18
-
19
-
20
-
21
-
22
-
23
-
24
-
25
-
26
-
27
-
28
-
29
-
30
-
31
-
32
-
33
-
34
-
35
-
36
-
37
-
38
-
39
-
40
-
41
-
42
-
43
-
44
-
45
-
46
-
47
-
48
-
49
-
50
-
51
-
52
-
53
-
54
-
55
-
56
-
57
-
58
-
59
-
60
-
61
-
62
-
63
-
64
-
65
-
66
-
67
-
68
-
69
-
70
-
71
-
72
-
73
-
74
-
75
-
76
-
77
-
78
-
79
-
80
-
81
-
82
-
83
-
84
-
85
-
86
-
87
-
88
-
89
-
90
-
91
-
92
-
93
-
94
-
95
-
96
-
97
-
98
-
99
-
100
-
101
-
102
-
103
-
104
-
105
-
106
-
107
-
108
-
109
-
110
-
111
-
112
-
113
-
114
-
115
-
116
-
117
-
118
-
119
-
120
-
121
-
122
-
123
-
124
-
125
-
126
-
127
-
128
-
129
-
130
-
131
-
132
-
133
-
134
-
135
-
136
-
137
-
138
-
139
-
140
-
141
-
142
-
143
-
144
-
145
-
146
-
147
-
148
-
149
-
150
-
151
-
152
-
153
-
154
-
155
-
156
-
157
-
158
-
159
-
160
-
161
-
162
-
163
-
164
-
165
-
166
-
167
-
168
-
169
-
170
-
171
-
172
-
 173
173 -
 174
174 -
 175
175 -
 176
176 -
 177
177 -
 178
178 -
 179
179 -
 180
180 -
 181
181 -
 182
182 -
 183
183 -
 184
184 -
 185
185 -
 186
186 -
 187
187 -
 188
188 -
 189
189 -
 190
190 -
 191
191 -
 192
192 -
 193
193 -
194
-
195
-
196
-
197
-
198
-
199
-
200
-
201
-
202
-
203
-
204
-
205
-
206
-
207
-
208
-
209
-
210
-
211
-
212
-
213
-
214
-
215
-
216
-
217
-
218
-
219
-
220
-
221
-
222
-
223
-
224
-
225
-
226
-
227
-
228
-
229
-
230
-
231
-
232
-
233
-
234
-
235
-
236
-
237
-
238
-
239
-
240
-
241
-
242
-
243
-
244
-
245
-
246
-
247
-
248
-
249
-
250
-
251
-
252
-
253
-
254
-
255
-
256
-
257
-
258
-
259
-
260
-
261
-
262
-
263
-
264
-
265
-
266
-
267
-
268
-
269
-
270
-
271
-
272
-
273
-
274
-
275
-
276
-
277
-
278
-
279
-
280
-
281
-
282
-
283
-
284
-
285
-
286
-
287
-
288
-
289
-
290
-
291
-
292
-
293
-
294
-
295
-
296
-
297
-
298
-
299
-
300
-
301
-
302
-
303
-
304
-
305
-
306
-
307
-
308
-
309
-
310
-
311
-
312
-
313
-
314
-
315
-
316
-
317
-
318
-
319
-
320
-
321
-
322
-
323
-
324
-
325
-
326
-
327
-
328
-
329
-
330
-
331
-
332
-
333
-
334
-
335
-
336
-
337
-
338
-
339
-
340
-
341
-
342
-
343
-
344
-
345
-
346
-
347
-
348
-
349
-
350
-
351
-
352
-
353
-
354
-
355
-
356
-
357
-
358
-
359
-
360
-
361
-
362
-
363
-
364
-
365
-
366
-
367
-
368
-
369
-
370
-
371
-
372
-
373
-
374
 |
 |
182 FIAT GROUP
CONSOLIDATED
FINANCIAL
STATEMENTS
AT 31 DECEMBER
2009
NOTES
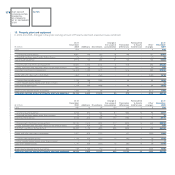
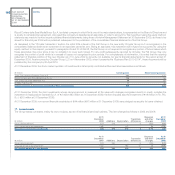
Current receivables and Other current assets19.
The composition of the caption is as follows:
(€ million) At 31 December 2009 At 31 December 2008
Trade receivables 3,649 4,390
Receivables from financing activities 12,695 13,136
Current tax receivables 674 770
Other current assets:
Other current receivables 2,529 2,373
Accrued income and prepaid expenses 249 227
Total Other current assets 2,778 2,600
Total Current receivables and Other current assets 19,796 20,896
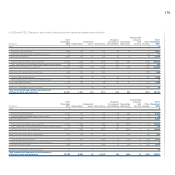
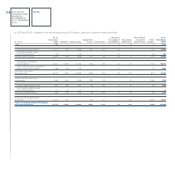
The analysis by due date is as follows:
At 31 December 2009 At 31 December 2008
due between due due between due
due within one and beyond due within one and beyond
(€ million) one year five years five years Total one year five years five years Total
Trade receivables 3,573 73 3 3,649 4,285 94 11 4,390
Receivables from financing activities 8,002 4,428 265 12,695 8,076 4,909 151 13,136
Current tax receivables 540 37 97 674 540 123 107 770
Other current receivables 1,480 991 58 2,529 2,090 248 35 2,373
Total Current receivables 13,595 5,529 423 19,547 14,991 5,374 304 20,669
At 31 December 2009, Current receivables include receivables sold and financed through both securitisation and factoring transactions of€6,588 million
(€6,190 million at 31 December 2008) which do not meet IAS 39 derecognition requirements. These receivables are recognised as such in the Group
financial statements even though they have been legally sold; a corresponding financial liability is recorded in the consolidated statement of financial position
as Asset-backed financing (see Note 27).
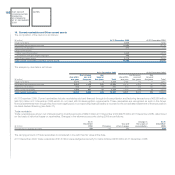
Trade receivables
Trade receivables are shown net of allowances for doubtful accounts of€524 million at 31 December 2009 (€478 million at 31 December 2008), determined
on the basis of historical losses on receivables. Changes in the allowance accounts during 2009 are as follows:
At 31 Change in At 31
December Use and the scope of December
(€ million) 2008 Provision other changes consolidation 2009
Allowances for doubtful accounts 478 135 (89) - 524
The carrying amount of Trade receivables is considered in line with their fair value at the date.
At 31 December 2009, trade receivables of€14 million were pledged as security for loans obtained (€36 million at 31 December 2008).