Chrysler 2009 Annual Report Download - page 184
Download and view the complete annual report
Please find page 184 of the 2009 Chrysler annual report below. You can navigate through the pages in the report by either clicking on the pages listed below, or by using the keyword search tool below to find specific information within the annual report.-
 1
1 -
2
-
3
-
4
-
5
-
6
-
7
-
8
-
9
-
10
-
11
-
12
-
13
-
14
-
15
-
16
-
17
-
18
-
19
-
20
-
21
-
22
-
23
-
24
-
25
-
26
-
27
-
28
-
29
-
30
-
31
-
32
-
33
-
34
-
35
-
36
-
37
-
38
-
39
-
40
-
41
-
42
-
43
-
44
-
45
-
46
-
47
-
48
-
49
-
50
-
51
-
52
-
53
-
54
-
55
-
56
-
57
-
58
-
59
-
60
-
61
-
62
-
63
-
64
-
65
-
66
-
67
-
68
-
69
-
70
-
71
-
72
-
73
-
74
-
75
-
76
-
77
-
78
-
79
-
80
-
81
-
82
-
83
-
84
-
85
-
86
-
87
-
88
-
89
-
90
-
91
-
92
-
93
-
94
-
95
-
96
-
97
-
98
-
99
-
100
-
101
-
102
-
103
-
104
-
105
-
106
-
107
-
108
-
109
-
110
-
111
-
112
-
113
-
114
-
115
-
116
-
117
-
118
-
119
-
120
-
121
-
122
-
123
-
124
-
125
-
126
-
127
-
128
-
129
-
130
-
131
-
132
-
133
-
134
-
135
-
136
-
137
-
138
-
139
-
140
-
141
-
142
-
143
-
144
-
145
-
146
-
147
-
148
-
149
-
150
-
151
-
152
-
153
-
154
-
155
-
156
-
157
-
158
-
159
-
160
-
161
-
162
-
163
-
164
-
165
-
166
-
167
-
168
-
169
-
170
-
171
-
172
-
173
-
 174
174 -
 175
175 -
 176
176 -
 177
177 -
 178
178 -
 179
179 -
 180
180 -
 181
181 -
 182
182 -
 183
183 -
 184
184 -
 185
185 -
 186
186 -
 187
187 -
 188
188 -
 189
189 -
 190
190 -
 191
191 -
 192
192 -
 193
193 -
 194
194 -
195
-
196
-
197
-
198
-
199
-
200
-
201
-
202
-
203
-
204
-
205
-
206
-
207
-
208
-
209
-
210
-
211
-
212
-
213
-
214
-
215
-
216
-
217
-
218
-
219
-
220
-
221
-
222
-
223
-
224
-
225
-
226
-
227
-
228
-
229
-
230
-
231
-
232
-
233
-
234
-
235
-
236
-
237
-
238
-
239
-
240
-
241
-
242
-
243
-
244
-
245
-
246
-
247
-
248
-
249
-
250
-
251
-
252
-
253
-
254
-
255
-
256
-
257
-
258
-
259
-
260
-
261
-
262
-
263
-
264
-
265
-
266
-
267
-
268
-
269
-
270
-
271
-
272
-
273
-
274
-
275
-
276
-
277
-
278
-
279
-
280
-
281
-
282
-
283
-
284
-
285
-
286
-
287
-
288
-
289
-
290
-
291
-
292
-
293
-
294
-
295
-
296
-
297
-
298
-
299
-
300
-
301
-
302
-
303
-
304
-
305
-
306
-
307
-
308
-
309
-
310
-
311
-
312
-
313
-
314
-
315
-
316
-
317
-
318
-
319
-
320
-
321
-
322
-
323
-
324
-
325
-
326
-
327
-
328
-
329
-
330
-
331
-
332
-
333
-
334
-
335
-
336
-
337
-
338
-
339
-
340
-
341
-
342
-
343
-
344
-
345
-
346
-
347
-
348
-
349
-
350
-
351
-
352
-
353
-
354
-
355
-
356
-
357
-
358
-
359
-
360
-
361
-
362
-
363
-
364
-
365
-
366
-
367
-
368
-
369
-
370
-
371
-
372
-
373
-
374
 |
 |

183
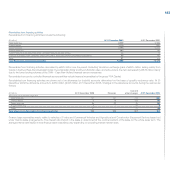
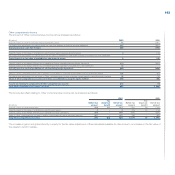
Receivables from financing activities
Receivables from financing activities include the following:
(€ million) At 31 December 2009 At 31 December 2008
Retail financing 6,239 6,593
Finance leases 1,110 885
Dealer financing 5,108 5,343
Supplier financing 102 88
Current financial receivables from jointly controlled financial services entities 14 3
Financial receivables from companies under joint control, associates and unconsolidated subsidiaries 55 80
Other 67 144
Total Receivables from financing activities 12,695 13,136
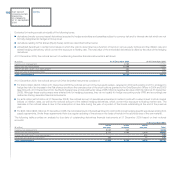
Receivables from financing activities decreased by€625 million over the period. Excluding translation exchange gains of€625 million, arising mainly from
trends in the Euro/Real, Euro/Australian Dollar, Euro/Canadian Dollar and Euro/US Dollar rates, and write-downs, the item decreased by€ 876 million mainly
due to the lower lending volumes of the CNH – Case New Holland financial service companies.
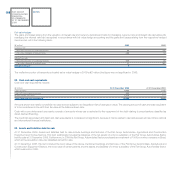
Receivables from jointly controlled financial services entities include financial receivables by the group FGA Capital.
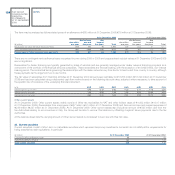
Receivables from financing activities are shown net of an allowance for doubtful accounts determined on the basis of specific insolvency risks. At 31
December 2009 the allowance amounts to€450 million (€345 million at 31 December 2008). Changes in the allowance accounts during the year are as
follows:
Use and
(€ million) At 31 December 2008 Provision other changes At 31 December 2009
Allowance for receivables regarding:
Retail financing 151 151 (72) 230
Finance leases 75 18 (13) 80
Dealer financing 66 33 (9) 90
Supplier financing 6 - (2) 4
Other 47 - (1) 46
Total allowance on Receivables from financing activities 345 202 (97) 450
Finance lease receivables mainly relate to vehicles of Trucks and Commercial Vehicles and Agricultural and Construction Equipment Sectors leased out
under finance lease arrangements. The interest rate implicit in the lease is determined at the commencement of the lease for the whole lease term. The
average interest rate implicit in total finance lease receivables vary depending on prevailing market interest rates.