Chrysler 2009 Annual Report Download - page 145
Download and view the complete annual report
Please find page 145 of the 2009 Chrysler annual report below. You can navigate through the pages in the report by either clicking on the pages listed below, or by using the keyword search tool below to find specific information within the annual report.-
 1
1 -
 2
2 -
 3
3 -
 4
4 -
 5
5 -
 6
6 -
 7
7 -
 8
8 -
 9
9 -
 10
10 -
 11
11 -
 12
12 -
 13
13 -
 14
14 -
 15
15 -
 16
16 -
 17
17 -
 18
18 -
 19
19 -
 20
20 -
 21
21 -
 22
22 -
 23
23 -
 24
24 -
 25
25 -
 26
26 -
 27
27 -
 28
28 -
 29
29 -
 30
30 -
 31
31 -
 32
32 -
 33
33 -
 34
34 -
 35
35 -
 36
36 -
 37
37 -
 38
38 -
 39
39 -
 40
40 -
 41
41 -
 42
42 -
 43
43 -
 44
44 -
 45
45 -
 46
46 -
 47
47 -
 48
48 -
 49
49 -
 50
50 -
 51
51 -
 52
52 -
 53
53 -
 54
54 -
 55
55 -
 56
56 -
 57
57 -
 58
58 -
 59
59 -
 60
60 -
 61
61 -
 62
62 -
 63
63 -
 64
64 -
 65
65 -
 66
66 -
 67
67 -
 68
68 -
 69
69 -
 70
70 -
 71
71 -
 72
72 -
 73
73 -
 74
74 -
 75
75 -
 76
76 -
 77
77 -
 78
78 -
 79
79 -
 80
80 -
 81
81 -
 82
82 -
 83
83 -
 84
84 -
 85
85 -
 86
86 -
 87
87 -
 88
88 -
 89
89 -
 90
90 -
 91
91 -
 92
92 -
 93
93 -
 94
94 -
 95
95 -
 96
96 -
 97
97 -
 98
98 -
 99
99 -
 100
100 -
 101
101 -
 102
102 -
 103
103 -
 104
104 -
 105
105 -
 106
106 -
 107
107 -
 108
108 -
 109
109 -
 110
110 -
 111
111 -
 112
112 -
 113
113 -
 114
114 -
 115
115 -
 116
116 -
 117
117 -
 118
118 -
 119
119 -
 120
120 -
 121
121 -
 122
122 -
 123
123 -
 124
124 -
 125
125 -
 126
126 -
 127
127 -
 128
128 -
 129
129 -
 130
130 -
 131
131 -
 132
132 -
 133
133 -
 134
134 -
 135
135 -
 136
136 -
 137
137 -
 138
138 -
 139
139 -
 140
140 -
 141
141 -
 142
142 -
 143
143 -
 144
144 -
 145
145 -
 146
146 -
 147
147 -
 148
148 -
 149
149 -
 150
150 -
 151
151 -
 152
152 -
 153
153 -
 154
154 -
 155
155 -
 156
156 -
 157
157 -
 158
158 -
 159
159 -
 160
160 -
 161
161 -
 162
162 -
 163
163 -
 164
164 -
 165
165 -
 166
166 -
 167
167 -
 168
168 -
 169
169 -
 170
170 -
 171
171 -
 172
172 -
 173
173 -
 174
174 -
 175
175 -
 176
176 -
 177
177 -
 178
178 -
 179
179 -
 180
180 -
 181
181 -
 182
182 -
 183
183 -
 184
184 -
 185
185 -
 186
186 -
 187
187 -
 188
188 -
 189
189 -
 190
190 -
 191
191 -
 192
192 -
 193
193 -
 194
194 -
 195
195 -
 196
196 -
 197
197 -
 198
198 -
 199
199 -
 200
200 -
 201
201 -
 202
202 -
 203
203 -
 204
204 -
 205
205 -
 206
206 -
 207
207 -
 208
208 -
 209
209 -
 210
210 -
 211
211 -
 212
212 -
 213
213 -
 214
214 -
 215
215 -
 216
216 -
 217
217 -
 218
218 -
 219
219 -
 220
220 -
 221
221 -
 222
222 -
 223
223 -
 224
224 -
 225
225 -
 226
226 -
 227
227 -
 228
228 -
 229
229 -
 230
230 -
 231
231 -
 232
232 -
 233
233 -
 234
234 -
 235
235 -
 236
236 -
 237
237 -
 238
238 -
 239
239 -
 240
240 -
 241
241 -
 242
242 -
 243
243 -
 244
244 -
 245
245 -
 246
246 -
 247
247 -
 248
248 -
 249
249 -
 250
250 -
 251
251 -
 252
252 -
 253
253 -
 254
254 -
 255
255 -
 256
256 -
 257
257 -
 258
258 -
 259
259 -
 260
260 -
 261
261 -
 262
262 -
 263
263 -
 264
264 -
 265
265 -
 266
266 -
 267
267 -
 268
268 -
 269
269 -
 270
270 -
 271
271 -
 272
272 -
 273
273 -
 274
274 -
 275
275 -
 276
276 -
 277
277 -
 278
278 -
 279
279 -
 280
280 -
 281
281 -
 282
282 -
 283
283 -
 284
284 -
 285
285 -
 286
286 -
 287
287 -
 288
288 -
 289
289 -
 290
290 -
 291
291 -
 292
292 -
 293
293 -
 294
294 -
 295
295 -
 296
296 -
 297
297 -
 298
298 -
 299
299 -
 300
300 -
 301
301 -
 302
302 -
 303
303 -
 304
304 -
 305
305 -
 306
306 -
 307
307 -
 308
308 -
 309
309 -
 310
310 -
 311
311 -
 312
312 -
 313
313 -
 314
314 -
 315
315 -
 316
316 -
 317
317 -
 318
318 -
 319
319 -
 320
320 -
 321
321 -
 322
322 -
 323
323 -
 324
324 -
 325
325 -
 326
326 -
 327
327 -
 328
328 -
 329
329 -
 330
330 -
 331
331 -
 332
332 -
 333
333 -
 334
334 -
 335
335 -
 336
336 -
 337
337 -
 338
338 -
 339
339 -
 340
340 -
 341
341 -
 342
342 -
 343
343 -
 344
344 -
 345
345 -
 346
346 -
 347
347 -
 348
348 -
 349
349 -
 350
350 -
 351
351 -
 352
352 -
 353
353 -
 354
354 -
 355
355 -
 356
356 -
 357
357 -
 358
358 -
 359
359 -
 360
360 -
 361
361 -
 362
362 -
 363
363 -
 364
364 -
 365
365 -
 366
366 -
 367
367 -
 368
368 -
 369
369 -
 370
370 -
 371
371 -
 372
372 -
 373
373 -
 374
374
 |
 |

144 FIAT GROUP
CONSOLIDATED
FINANCIAL
STATEMENTS
AT 31 DECEMBER
2009
NOTES
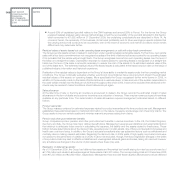
Around 60% of capitalised goodwill relates to the CNH business and around 28% to Ferrari. For the former the Group
prepared detailed analyses using various methodologies to test the recoverability of the goodwill allocated to this Sector,
which amounted to €1,662 million at 31 December 2009; the underlying considerations are described in Note 14. As
concerns Ferrari, the exclusivity of the business, its historical profitability and its future earnings prospects indicate that
the carrying amount will continue to be recoverable, even in the event of economic and market conditions which remain
difficult and may deteriorate further.
Residual values of assets leased out under operating lease arrangements or sold with a buy-back commitment
The Group reports assets rented or leased to customers under operating leases as tangible assets. Furthermore, new vehicle
sales with a buy-back commitment are not recognised as sales at the time of delivery but are accounted for as operating leases
if it is probable that the vehicle will be bought back. The Group recognises income from such operating leases over the term of
the lease on a straight-line basis. Depreciation expense for assets subject to operating leases is recognised on a straight-line
basis over the term of the lease in amounts necessary to reduce the cost of the assets to its estimated residual value at the
end of the lease term. The estimated residual value of the leased assets is calculated at the lease inception date on the basis of
published industry information and historical experience.
Realisation of the residual values is dependant on the Group’s future ability to market the assets under the then-prevailing market
conditions. The Group continually evaluates whether events and circumstances have occurred which impact the estimated
residual values of the assets on operating leases. More specifically the Group recognised further write-downs in 2009, in
addition to those usually made on the basis of historical trends in residual values, to take account of the sudden deterioration in
the used vehicle market over the final part of 2008 and throughout the whole 2009. It cannot be excluded that additional write-
downs may be needed if market conditions should deteriorate yet again.
Sales allowance
At the later time of sale or the time an incentive is announced to dealers, the Group records the estimated impact of sales
allowances in the form of dealer and customer incentives as a reduction of revenue. There may be numerous types of incentives
available at any particular time. The determination of sales allowances requires management estimates based on different
factors.
Product warranties
The Group makes provisions for estimated expenses related to product warranties at the time products are sold. Management
establishes these estimates based on historical information on the nature, frequency and average cost of warranty claims. The
Group seeks to improve vehicle quality and minimise warranty expenses arising from claims.
Pension and other post-retirement benefits
Group companies sponsor pension and other post-retirement benefits in various countries. In the US, the United Kingdom,
Germany and Italy, the Group has major defined benefit plans. Management uses several statistical and judgmental factors
that attempt to anticipate future events in calculating the expense, the liability and the assets related to these plans. These
factors include assumptions about the discount rate, expected return on plan assets, rate of future compensation increases and
health care cost trend rates. In addition, the Group’s actuarial consultants also use subjective factors such as withdrawal and
mortality rates in making relevant estimates. Regarding the discount rate, in 2009 yields of high quality corporate bonds were
not subject to the same level of volatility as in 2008. It cannot be excluded, though, that future significant changes in the yields
of corporate bonds may lead to effects on liabilities and unrecognised actuarial gains and losses, taking into account however
any simultaneous changes in the returns of plan assets where these may exist.
Realisation of deferred tax assets
As of 31 December 2009, the Group had deferred tax assets and theoretical tax benefit arising from tax loss carryforwards of
€7,784 million and valuation allowances against these assets of €3,307 million. The corresponding totals at 31 December 2008
were €7,325 million and €2,899 million, respectively. Management has recorded these valuation allowances to reduce deferred
