Chrysler 2009 Annual Report Download - page 281
Download and view the complete annual report
Please find page 281 of the 2009 Chrysler annual report below. You can navigate through the pages in the report by either clicking on the pages listed below, or by using the keyword search tool below to find specific information within the annual report.-
 1
1 -
2
-
3
-
4
-
5
-
6
-
7
-
8
-
9
-
10
-
11
-
12
-
13
-
14
-
15
-
16
-
17
-
18
-
19
-
20
-
21
-
22
-
23
-
24
-
25
-
26
-
27
-
28
-
29
-
30
-
31
-
32
-
33
-
34
-
35
-
36
-
37
-
38
-
39
-
40
-
41
-
42
-
43
-
44
-
45
-
46
-
47
-
48
-
49
-
50
-
51
-
52
-
53
-
54
-
55
-
56
-
57
-
58
-
59
-
60
-
61
-
62
-
63
-
64
-
65
-
66
-
67
-
68
-
69
-
70
-
71
-
72
-
73
-
74
-
75
-
76
-
77
-
78
-
79
-
80
-
81
-
82
-
83
-
84
-
85
-
86
-
87
-
88
-
89
-
90
-
91
-
92
-
93
-
94
-
95
-
96
-
97
-
98
-
99
-
100
-
101
-
102
-
103
-
104
-
105
-
106
-
107
-
108
-
109
-
110
-
111
-
112
-
113
-
114
-
115
-
116
-
117
-
118
-
119
-
120
-
121
-
122
-
123
-
124
-
125
-
126
-
127
-
128
-
129
-
130
-
131
-
132
-
133
-
134
-
135
-
136
-
137
-
138
-
139
-
140
-
141
-
142
-
143
-
144
-
145
-
146
-
147
-
148
-
149
-
150
-
151
-
152
-
153
-
154
-
155
-
156
-
157
-
158
-
159
-
160
-
161
-
162
-
163
-
164
-
165
-
166
-
167
-
168
-
169
-
170
-
171
-
172
-
173
-
174
-
175
-
176
-
177
-
178
-
179
-
180
-
181
-
182
-
183
-
184
-
185
-
186
-
187
-
188
-
189
-
190
-
191
-
192
-
193
-
194
-
195
-
196
-
197
-
198
-
199
-
200
-
201
-
202
-
203
-
204
-
205
-
206
-
207
-
208
-
209
-
210
-
211
-
212
-
213
-
214
-
215
-
216
-
217
-
218
-
219
-
220
-
221
-
222
-
223
-
224
-
225
-
226
-
227
-
228
-
229
-
230
-
231
-
232
-
233
-
234
-
235
-
236
-
237
-
238
-
239
-
240
-
241
-
242
-
243
-
244
-
245
-
246
-
247
-
248
-
249
-
250
-
251
-
252
-
253
-
254
-
255
-
256
-
257
-
258
-
259
-
260
-
261
-
262
-
263
-
264
-
265
-
266
-
267
-
268
-
269
-
270
-
 271
271 -
 272
272 -
 273
273 -
 274
274 -
 275
275 -
 276
276 -
 277
277 -
 278
278 -
 279
279 -
 280
280 -
 281
281 -
 282
282 -
 283
283 -
 284
284 -
 285
285 -
 286
286 -
 287
287 -
 288
288 -
 289
289 -
 290
290 -
 291
291 -
292
-
293
-
294
-
295
-
296
-
297
-
298
-
299
-
300
-
301
-
302
-
303
-
304
-
305
-
306
-
307
-
308
-
309
-
310
-
311
-
312
-
313
-
314
-
315
-
316
-
317
-
318
-
319
-
320
-
321
-
322
-
323
-
324
-
325
-
326
-
327
-
328
-
329
-
330
-
331
-
332
-
333
-
334
-
335
-
336
-
337
-
338
-
339
-
340
-
341
-
342
-
343
-
344
-
345
-
346
-
347
-
348
-
349
-
350
-
351
-
352
-
353
-
354
-
355
-
356
-
357
-
358
-
359
-
360
-
361
-
362
-
363
-
364
-
365
-
366
-
367
-
368
-
369
-
370
-
371
-
372
-
373
-
374
 |
 |

FIAT S.P.A.
STATUTORY
FINANCIAL
STATEMENTS AT
31 DECEMBER
2009
NOTES
280
with international practice in the automotive sector. For the Statement of Financial Position, Fiat S.p.A. has elected the “current
and non-current” classification for the presentation of assets and liabilities. A mixed presentation has been selected for the
presentation of the Consolidated Statement of Financial Position, as permitted under IAS 1, with assets only being classified
between current and non-current. This election was made in view of the fact that the Consolidated Statement of Financial
Position includes both industrial companies and financial services companies. The investment portfolios of financial services are
included in current assets in the Consolidated Statement of Financial Position, as the investments will be realised in their normal
operating cycle. Financial services companies, though, obtain funds only partially from the market: the remaining are obtained
from the Group’s treasury companies (included in industrial companies), which lend funds both to industrial Group companies
and to financial services companies as the need arises.
Given the distribution of the financial services within the Group any distinction between current and non-current financial
liabilities in the Consolidated Statement of Financial Position would not be meaningful. There is no impact, however, on the
presentation of liabilities for Fiat S.p.A.
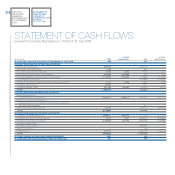
The Statement of Cash Flows is presented using the indirect method.
In connection with the requirements of Consob Resolution 15519 of 27 July 2006 as to the format of the financial statements,
specific supplementary Income Statement, Statement of Financial Position and Statement of Cash Flows formats have been
added for related party transactions so as not to compromise an overall reading of the statements.
Intangible assets
Purchased or internally-generated intangible assets are recognised as assets in accordance with IAS 38 - Intangible Assets,
where it is probable that the use of the asset will generate future economic benefits and where the costs of the asset can be
determined reliably.
Intangible assets with finite useful lives are measured at purchase or manufacturing cost, net of amortisation charged on a
straight-line basis over their estimated useful lives and of any impairment losses.
Property, plant and equipment
Cost
Property, plant and equipment are stated at acquisition or production cost, net of accumulated depreciation and any impairment
losses, and are not revalued.
Subsequent expenditures are capitalised only if they increase the future economic benefits embodied in that asset. All other
expenditures are expensed as incurred.
The assets are depreciated by the method and at the rates indicated below.
Leases where the lessor retains substantially all the risks and rewards of ownership of the assets are classified as operating
leases. Operating lease expenditures are expensed on a straight-line basis over the lease term.
Depreciation
Depreciation is calculated on a straight-line basis over the estimated useful life of an asset as follows:
Annual depreciation rate
Buildings 3%
Plant 10%
Furniture 12%
Fixtures 20%
Vehicles 25%
Land is not depreciated.