Chrysler 2009 Annual Report Download - page 208
Download and view the complete annual report
Please find page 208 of the 2009 Chrysler annual report below. You can navigate through the pages in the report by either clicking on the pages listed below, or by using the keyword search tool below to find specific information within the annual report.-
 1
1 -
2
-
3
-
4
-
5
-
6
-
7
-
8
-
9
-
10
-
11
-
12
-
13
-
14
-
15
-
16
-
17
-
18
-
19
-
20
-
21
-
22
-
23
-
24
-
25
-
26
-
27
-
28
-
29
-
30
-
31
-
32
-
33
-
34
-
35
-
36
-
37
-
38
-
39
-
40
-
41
-
42
-
43
-
44
-
45
-
46
-
47
-
48
-
49
-
50
-
51
-
52
-
53
-
54
-
55
-
56
-
57
-
58
-
59
-
60
-
61
-
62
-
63
-
64
-
65
-
66
-
67
-
68
-
69
-
70
-
71
-
72
-
73
-
74
-
75
-
76
-
77
-
78
-
79
-
80
-
81
-
82
-
83
-
84
-
85
-
86
-
87
-
88
-
89
-
90
-
91
-
92
-
93
-
94
-
95
-
96
-
97
-
98
-
99
-
100
-
101
-
102
-
103
-
104
-
105
-
106
-
107
-
108
-
109
-
110
-
111
-
112
-
113
-
114
-
115
-
116
-
117
-
118
-
119
-
120
-
121
-
122
-
123
-
124
-
125
-
126
-
127
-
128
-
129
-
130
-
131
-
132
-
133
-
134
-
135
-
136
-
137
-
138
-
139
-
140
-
141
-
142
-
143
-
144
-
145
-
146
-
147
-
148
-
149
-
150
-
151
-
152
-
153
-
154
-
155
-
156
-
157
-
158
-
159
-
160
-
161
-
162
-
163
-
164
-
165
-
166
-
167
-
168
-
169
-
170
-
171
-
172
-
173
-
174
-
175
-
176
-
177
-
178
-
179
-
180
-
181
-
182
-
183
-
184
-
185
-
186
-
187
-
188
-
189
-
190
-
191
-
192
-
193
-
194
-
195
-
196
-
197
-
 198
198 -
 199
199 -
 200
200 -
 201
201 -
 202
202 -
 203
203 -
 204
204 -
 205
205 -
 206
206 -
 207
207 -
 208
208 -
 209
209 -
 210
210 -
 211
211 -
 212
212 -
 213
213 -
 214
214 -
 215
215 -
 216
216 -
 217
217 -
 218
218 -
219
-
220
-
221
-
222
-
223
-
224
-
225
-
226
-
227
-
228
-
229
-
230
-
231
-
232
-
233
-
234
-
235
-
236
-
237
-
238
-
239
-
240
-
241
-
242
-
243
-
244
-
245
-
246
-
247
-
248
-
249
-
250
-
251
-
252
-
253
-
254
-
255
-
256
-
257
-
258
-
259
-
260
-
261
-
262
-
263
-
264
-
265
-
266
-
267
-
268
-
269
-
270
-
271
-
272
-
273
-
274
-
275
-
276
-
277
-
278
-
279
-
280
-
281
-
282
-
283
-
284
-
285
-
286
-
287
-
288
-
289
-
290
-
291
-
292
-
293
-
294
-
295
-
296
-
297
-
298
-
299
-
300
-
301
-
302
-
303
-
304
-
305
-
306
-
307
-
308
-
309
-
310
-
311
-
312
-
313
-
314
-
315
-
316
-
317
-
318
-
319
-
320
-
321
-
322
-
323
-
324
-
325
-
326
-
327
-
328
-
329
-
330
-
331
-
332
-
333
-
334
-
335
-
336
-
337
-
338
-
339
-
340
-
341
-
342
-
343
-
344
-
345
-
346
-
347
-
348
-
349
-
350
-
351
-
352
-
353
-
354
-
355
-
356
-
357
-
358
-
359
-
360
-
361
-
362
-
363
-
364
-
365
-
366
-
367
-
368
-
369
-
370
-
371
-
372
-
373
-
374
 |
 |

207
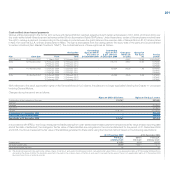
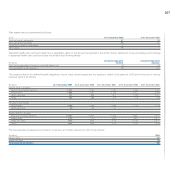
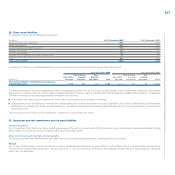
Plan assets may be summarised as follows:
(in %) At 31 December 2009 At 31 December 2008
Third party equity instruments 37 35
Third party debt instruments 50 57
Properties occupied by third parties 1 1
Other assets 12 7
Assumed health care cost trend rates have a significant effect on the amount recognised in the 2009 income statement. A one percentage point change
in assumed health care cost trend rates would have the following effects:
One percentage point One percentage point
(€ million) increase decrease
Effect on the aggregate of the service costs and interest cost 5 (5)
Effect on defined benefit obligation 76 (64)
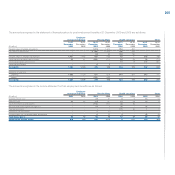
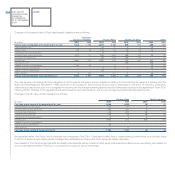
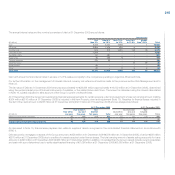
The present value of the defined benefit obligations, the fair value of plan assets and the surplus or deficit of the plans for 2009 and at the end of the four
previous years is as follows:
(€ million) At 31 December 2009 At 31 December 2008 At 31 December 2007 At 31 December 2006 At 31 December 2005
Present value of obligation:
Employee severance indemnity 1,001 1,062 1,133 1,362 1,417
Pension plans 2,568 2,267 2,730 3,107 3,186
Health care plans 794 848 817 1,109 1,417
Others 258 288 279 278 323
Fair value of plan assets:
Pension plans 1,796 1,554 2,036 2,176 2,115
Health care plans 46 39 47 - -
Surplus (deficit) of the plan:
Employee severance indemnity (1,001) (1,062) (1,133) (1,362) (1,417)
Pension plans (772) (713) (694) (931) (1,071)
Health care plans (748) (809) (770) (1,109) (1,417)
Others (258) (288) (279) (278) (323)
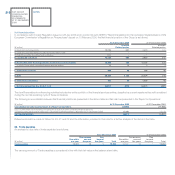
The best estimate of expected contribution to pension and health care plan for 2010 is as follows:
(€ million) 2010
Pension plans 136
Health care plans 59
Total expected contribution 195