Chrysler 2009 Annual Report Download - page 172
Download and view the complete annual report
Please find page 172 of the 2009 Chrysler annual report below. You can navigate through the pages in the report by either clicking on the pages listed below, or by using the keyword search tool below to find specific information within the annual report.-
 1
1 -
2
-
3
-
4
-
5
-
6
-
7
-
8
-
9
-
10
-
11
-
12
-
13
-
14
-
15
-
16
-
17
-
18
-
19
-
20
-
21
-
22
-
23
-
24
-
25
-
26
-
27
-
28
-
29
-
30
-
31
-
32
-
33
-
34
-
35
-
36
-
37
-
38
-
39
-
40
-
41
-
42
-
43
-
44
-
45
-
46
-
47
-
48
-
49
-
50
-
51
-
52
-
53
-
54
-
55
-
56
-
57
-
58
-
59
-
60
-
61
-
62
-
63
-
64
-
65
-
66
-
67
-
68
-
69
-
70
-
71
-
72
-
73
-
74
-
75
-
76
-
77
-
78
-
79
-
80
-
81
-
82
-
83
-
84
-
85
-
86
-
87
-
88
-
89
-
90
-
91
-
92
-
93
-
94
-
95
-
96
-
97
-
98
-
99
-
100
-
101
-
102
-
103
-
104
-
105
-
106
-
107
-
108
-
109
-
110
-
111
-
112
-
113
-
114
-
115
-
116
-
117
-
118
-
119
-
120
-
121
-
122
-
123
-
124
-
125
-
126
-
127
-
128
-
129
-
130
-
131
-
132
-
133
-
134
-
135
-
136
-
137
-
138
-
139
-
140
-
141
-
142
-
143
-
144
-
145
-
146
-
147
-
148
-
149
-
150
-
151
-
152
-
153
-
154
-
155
-
156
-
157
-
158
-
159
-
160
-
161
-
 162
162 -
 163
163 -
 164
164 -
 165
165 -
 166
166 -
 167
167 -
 168
168 -
 169
169 -
 170
170 -
 171
171 -
 172
172 -
 173
173 -
 174
174 -
 175
175 -
 176
176 -
 177
177 -
 178
178 -
 179
179 -
 180
180 -
 181
181 -
 182
182 -
183
-
184
-
185
-
186
-
187
-
188
-
189
-
190
-
191
-
192
-
193
-
194
-
195
-
196
-
197
-
198
-
199
-
200
-
201
-
202
-
203
-
204
-
205
-
206
-
207
-
208
-
209
-
210
-
211
-
212
-
213
-
214
-
215
-
216
-
217
-
218
-
219
-
220
-
221
-
222
-
223
-
224
-
225
-
226
-
227
-
228
-
229
-
230
-
231
-
232
-
233
-
234
-
235
-
236
-
237
-
238
-
239
-
240
-
241
-
242
-
243
-
244
-
245
-
246
-
247
-
248
-
249
-
250
-
251
-
252
-
253
-
254
-
255
-
256
-
257
-
258
-
259
-
260
-
261
-
262
-
263
-
264
-
265
-
266
-
267
-
268
-
269
-
270
-
271
-
272
-
273
-
274
-
275
-
276
-
277
-
278
-
279
-
280
-
281
-
282
-
283
-
284
-
285
-
286
-
287
-
288
-
289
-
290
-
291
-
292
-
293
-
294
-
295
-
296
-
297
-
298
-
299
-
300
-
301
-
302
-
303
-
304
-
305
-
306
-
307
-
308
-
309
-
310
-
311
-
312
-
313
-
314
-
315
-
316
-
317
-
318
-
319
-
320
-
321
-
322
-
323
-
324
-
325
-
326
-
327
-
328
-
329
-
330
-
331
-
332
-
333
-
334
-
335
-
336
-
337
-
338
-
339
-
340
-
341
-
342
-
343
-
344
-
345
-
346
-
347
-
348
-
349
-
350
-
351
-
352
-
353
-
354
-
355
-
356
-
357
-
358
-
359
-
360
-
361
-
362
-
363
-
364
-
365
-
366
-
367
-
368
-
369
-
370
-
371
-
372
-
373
-
374
 |
 |

171
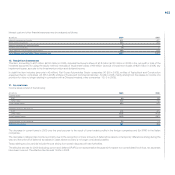
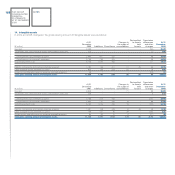
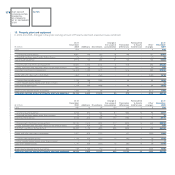
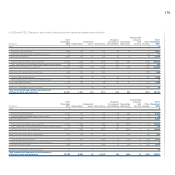
Goodwill, trademarks and intangible assets with indefinite useful life
Goodwill is allocated to the Group’s cash-generating units (“CGUs”) identified as the Group’s operating sectors. The following table presents the allocation
of goodwill across the Sectors:
(€ million) At 31 December 2009 At 31 December 2008
Agricultural and Construction equipment 1,662 1,699
Ferrari 786 786
Production Systems 125 133
Component 118 112
Trucks and Commercial Vehicles 56 56
Metallurgical Products 18 18
Fiat Group Automobiles 10 10
FPT Powertrain Technologies 1 1
Goodwill net carrying amount 2,776 2,815
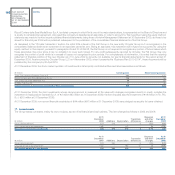
At 31 December 2009 Trademarks and other intangible assets with indefinite useful lives, attributable for€162 million (€167 million at 31 December 2008)
to the CNH – Case New Holland, consist of acquired trademarks and similar rights which have no legal, contractual, competitive or economic that limits their
useful life. For the purposes of impairment testing, those assets were attributed to the respective cash-generating units without the need for any recognition
of impairment.
In particular the vast majority of goodwill, representing approximately 93% of the total, is allocated to cash-generating units in the Agricultural and Construction
equipment, Ferrari and Production Systems Sectors. The cash-generating units considered for the testing of the recoverability of the goodwill are generally
the product lines of the Sectors themselves.
The recoverable amount of the cash-generating units to which goodwill and other intangible assets with an indefinite useful life have been allocated is
determined on the basis of their value in use, defined as the discounted value of the expected future operating cash flows at a rate of return that incorporates
the risks associated with the particular cash-generating units as of the valuation date. The discounted cash flows approach is dependent on several critical
management assumptions, including estimates of future sales growth, gross margins, operating costs, terminal value growth rates, capital expenditures,
changes in working capital requirements and the weighted average cost of capital (discount rate). More in particular:
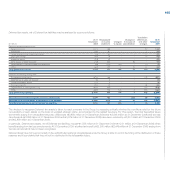
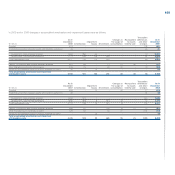
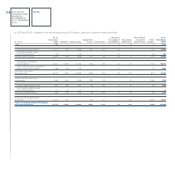
In the CNH – Case New Holland Sector, the cash generating units to which goodwill has been allocated consist of the different brands (CaseIH and New
Holland for agricultural equipment, Case and New Holland Construction for construction equipment and financial services). In detail:
Amount allocated to goodwill
(€ million) at 31 December 2009
Agricultural equipment 1,187
Construction equipment 387
Financial services 88
Total 1,662
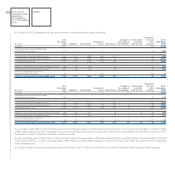
To determine the recoverable amount of these cash-generating units, the Sector relied on discounted cash flows and, as a further method, on market
multiples. In particular, the Sector used the discounted cash flows approach as the primary approach for measuring the value in use of the Equipment
Operations businesses, while used the total asset market multiples approach as the primary approach for measuring the fair value of the Financial Services
reporting unit.