Chrysler 2009 Annual Report Download - page 69
Download and view the complete annual report
Please find page 69 of the 2009 Chrysler annual report below. You can navigate through the pages in the report by either clicking on the pages listed below, or by using the keyword search tool below to find specific information within the annual report.-
 1
1 -
2
-
3
-
4
-
5
-
6
-
7
-
8
-
9
-
10
-
11
-
12
-
13
-
14
-
15
-
16
-
17
-
18
-
19
-
20
-
21
-
22
-
23
-
24
-
25
-
26
-
27
-
28
-
29
-
30
-
31
-
32
-
33
-
34
-
35
-
36
-
37
-
38
-
39
-
40
-
41
-
42
-
43
-
44
-
45
-
46
-
47
-
48
-
49
-
50
-
51
-
52
-
53
-
54
-
55
-
56
-
57
-
58
-
 59
59 -
 60
60 -
 61
61 -
 62
62 -
 63
63 -
 64
64 -
 65
65 -
 66
66 -
 67
67 -
 68
68 -
 69
69 -
 70
70 -
 71
71 -
 72
72 -
 73
73 -
 74
74 -
 75
75 -
 76
76 -
 77
77 -
 78
78 -
 79
79 -
80
-
81
-
82
-
83
-
84
-
85
-
86
-
87
-
88
-
89
-
90
-
91
-
92
-
93
-
94
-
95
-
96
-
97
-
98
-
99
-
100
-
101
-
102
-
103
-
104
-
105
-
106
-
107
-
108
-
109
-
110
-
111
-
112
-
113
-
114
-
115
-
116
-
117
-
118
-
119
-
120
-
121
-
122
-
123
-
124
-
125
-
126
-
127
-
128
-
129
-
130
-
131
-
132
-
133
-
134
-
135
-
136
-
137
-
138
-
139
-
140
-
141
-
142
-
143
-
144
-
145
-
146
-
147
-
148
-
149
-
150
-
151
-
152
-
153
-
154
-
155
-
156
-
157
-
158
-
159
-
160
-
161
-
162
-
163
-
164
-
165
-
166
-
167
-
168
-
169
-
170
-
171
-
172
-
173
-
174
-
175
-
176
-
177
-
178
-
179
-
180
-
181
-
182
-
183
-
184
-
185
-
186
-
187
-
188
-
189
-
190
-
191
-
192
-
193
-
194
-
195
-
196
-
197
-
198
-
199
-
200
-
201
-
202
-
203
-
204
-
205
-
206
-
207
-
208
-
209
-
210
-
211
-
212
-
213
-
214
-
215
-
216
-
217
-
218
-
219
-
220
-
221
-
222
-
223
-
224
-
225
-
226
-
227
-
228
-
229
-
230
-
231
-
232
-
233
-
234
-
235
-
236
-
237
-
238
-
239
-
240
-
241
-
242
-
243
-
244
-
245
-
246
-
247
-
248
-
249
-
250
-
251
-
252
-
253
-
254
-
255
-
256
-
257
-
258
-
259
-
260
-
261
-
262
-
263
-
264
-
265
-
266
-
267
-
268
-
269
-
270
-
271
-
272
-
273
-
274
-
275
-
276
-
277
-
278
-
279
-
280
-
281
-
282
-
283
-
284
-
285
-
286
-
287
-
288
-
289
-
290
-
291
-
292
-
293
-
294
-
295
-
296
-
297
-
298
-
299
-
300
-
301
-
302
-
303
-
304
-
305
-
306
-
307
-
308
-
309
-
310
-
311
-
312
-
313
-
314
-
315
-
316
-
317
-
318
-
319
-
320
-
321
-
322
-
323
-
324
-
325
-
326
-
327
-
328
-
329
-
330
-
331
-
332
-
333
-
334
-
335
-
336
-
337
-
338
-
339
-
340
-
341
-
342
-
343
-
344
-
345
-
346
-
347
-
348
-
349
-
350
-
351
-
352
-
353
-
354
-
355
-
356
-
357
-
358
-
359
-
360
-
361
-
362
-
363
-
364
-
365
-
366
-
367
-
368
-
369
-
370
-
371
-
372
-
373
-
374
 |
 |

REPORT ON
OPERATIONS
FINANCIAL
REVIEW -
FIAT GROUP
68
Financial Services
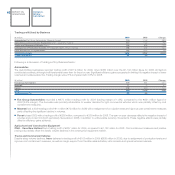
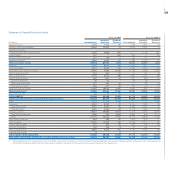
Net revenues for Financial Services totalled €1,467 million, down 4.4% over 2008.
(€ million) 2009 2008 (*) % change
Fiat Group Automobiles 168 160 5.0
Ferrari 22 14 57.1
Agricultural and Construction Equipment (CNH - Case New Holland) 1,129 1,227 -8.0
Trucks and Commercial Vehicles (Iveco) 151 137 10.2
Holding and Other Companies, and Eliminations (3) (3) -
Total 1,467 1,535 -4.4
(*) Following adoption of the improvement to IAS 16 in 2009, as described in the Notes to the Consolidated Financial Statements, the amount previously reported for CNH - Case New Holland for
2008 was increased by €58 million.
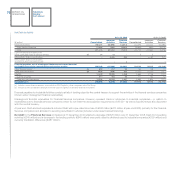
Financial Services for Fiat Group Automobiles reported revenues of €168 million for year, compared with the €160 million figure for 2008. The 5% increase
was primarily attributable to the positive performance of retail activities in Brazil.
Financial Services for the Agricultural and Construction Equipment Sector reported revenues of €1,129 million, down 8% (-12.7% in US dollar terms) over
2008, reflecting a decrease in the portfolio attributable to declines in sales volumes for both the agricultural and construction equipment segments only
partially offset by the positive effect of currency translation differences.
Iveco Financial Services had net revenues of €151 million, up 10.2% over the €137 million figure for 2008. The increase was attributable to new sales finance
activities for CNH in Eastern Europe (where CNH has no financial services companies), as well as to higher interest income for traditional activities.
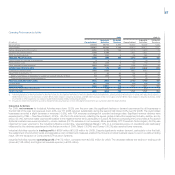
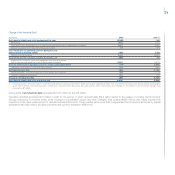
Trading profit totalled €168 million for the year, down €156 million over 2008 due to declines for CNH and Iveco.
(€ million) 2009 2008 Change
Fiat Group Automobiles 35 40 -5
Ferrari 6 2 4
Agricultural and Construction Equipment (CNH - Case New Holland) 153 265 -112
Trucks and Commercial Vehicles (Iveco) (26) 18 -44
Holding and Other Companies, and Eliminations - (1) 1
Total 168 324 -156
Trading profit for the Financial Services businesses of Fiat Group Automobiles totalled €35 million for 2009, down €5 million over the €40 million figure for
2008. The reduction is primarily due to higher provisions and a decrease in market rates of interest.
Trading profit for CNH - Case New Holland’s Financial Services totalled €153 million for the year, compared with €265 million for 2008. This decrease was
due to lower net interest margins and higher provisions connected to the downturn in the US and European construction equipment markets, as well as
additional provisions for the agricultural equipment portfolio in Brazil. Reductions in sales, general and administrative expense only partially offset the lower
net interest margins and increased provisions.
Iveco’s Financial Services businesses reported a trading loss of €26 million (compared with a trading profit of €18 million for 2008), primarily attributable
to higher risk provisions on the portfolio (particularly for Eastern Europe).