Chrysler 2009 Annual Report Download - page 279
Download and view the complete annual report
Please find page 279 of the 2009 Chrysler annual report below. You can navigate through the pages in the report by either clicking on the pages listed below, or by using the keyword search tool below to find specific information within the annual report.-
 1
1 -
2
-
3
-
4
-
5
-
6
-
7
-
8
-
9
-
10
-
11
-
12
-
13
-
14
-
15
-
16
-
17
-
18
-
19
-
20
-
21
-
22
-
23
-
24
-
25
-
26
-
27
-
28
-
29
-
30
-
31
-
32
-
33
-
34
-
35
-
36
-
37
-
38
-
39
-
40
-
41
-
42
-
43
-
44
-
45
-
46
-
47
-
48
-
49
-
50
-
51
-
52
-
53
-
54
-
55
-
56
-
57
-
58
-
59
-
60
-
61
-
62
-
63
-
64
-
65
-
66
-
67
-
68
-
69
-
70
-
71
-
72
-
73
-
74
-
75
-
76
-
77
-
78
-
79
-
80
-
81
-
82
-
83
-
84
-
85
-
86
-
87
-
88
-
89
-
90
-
91
-
92
-
93
-
94
-
95
-
96
-
97
-
98
-
99
-
100
-
101
-
102
-
103
-
104
-
105
-
106
-
107
-
108
-
109
-
110
-
111
-
112
-
113
-
114
-
115
-
116
-
117
-
118
-
119
-
120
-
121
-
122
-
123
-
124
-
125
-
126
-
127
-
128
-
129
-
130
-
131
-
132
-
133
-
134
-
135
-
136
-
137
-
138
-
139
-
140
-
141
-
142
-
143
-
144
-
145
-
146
-
147
-
148
-
149
-
150
-
151
-
152
-
153
-
154
-
155
-
156
-
157
-
158
-
159
-
160
-
161
-
162
-
163
-
164
-
165
-
166
-
167
-
168
-
169
-
170
-
171
-
172
-
173
-
174
-
175
-
176
-
177
-
178
-
179
-
180
-
181
-
182
-
183
-
184
-
185
-
186
-
187
-
188
-
189
-
190
-
191
-
192
-
193
-
194
-
195
-
196
-
197
-
198
-
199
-
200
-
201
-
202
-
203
-
204
-
205
-
206
-
207
-
208
-
209
-
210
-
211
-
212
-
213
-
214
-
215
-
216
-
217
-
218
-
219
-
220
-
221
-
222
-
223
-
224
-
225
-
226
-
227
-
228
-
229
-
230
-
231
-
232
-
233
-
234
-
235
-
236
-
237
-
238
-
239
-
240
-
241
-
242
-
243
-
244
-
245
-
246
-
247
-
248
-
249
-
250
-
251
-
252
-
253
-
254
-
255
-
256
-
257
-
258
-
259
-
260
-
261
-
262
-
263
-
264
-
265
-
266
-
267
-
268
-
 269
269 -
 270
270 -
 271
271 -
 272
272 -
 273
273 -
 274
274 -
 275
275 -
 276
276 -
 277
277 -
 278
278 -
 279
279 -
 280
280 -
 281
281 -
 282
282 -
 283
283 -
 284
284 -
 285
285 -
 286
286 -
 287
287 -
 288
288 -
 289
289 -
290
-
291
-
292
-
293
-
294
-
295
-
296
-
297
-
298
-
299
-
300
-
301
-
302
-
303
-
304
-
305
-
306
-
307
-
308
-
309
-
310
-
311
-
312
-
313
-
314
-
315
-
316
-
317
-
318
-
319
-
320
-
321
-
322
-
323
-
324
-
325
-
326
-
327
-
328
-
329
-
330
-
331
-
332
-
333
-
334
-
335
-
336
-
337
-
338
-
339
-
340
-
341
-
342
-
343
-
344
-
345
-
346
-
347
-
348
-
349
-
350
-
351
-
352
-
353
-
354
-
355
-
356
-
357
-
358
-
359
-
360
-
361
-
362
-
363
-
364
-
365
-
366
-
367
-
368
-
369
-
370
-
371
-
372
-
373
-
374
 |
 |

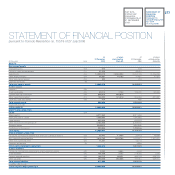
FIAT S.P.A.
STATUTORY
FINANCIAL
STATEMENTS AT
31 DECEMBER
2009
278
STATEMENT OF
CASH FLOWS
PURSUANT TO
CONSOB RESOLUTION
NO. 15519
OF 27 JULY 2006
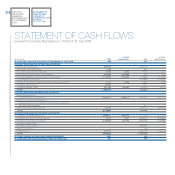
STATEMENT OF CASH FLOWS
pursuant to Consob Resolution no. 15519 of 27 July 2006
of which of which
(€ thousand) 2009 related parties 2008 related parties
A) CASH AND CASH EQUIVALENTS AT BEGINNING OF THE YEAR 495 524
B) CASH FROM/(USED IN) OPERATING ACTIVITIES:
Profit/(loss) for the period 339,964 1,199,146
Amortisation and depreciation 1,706 1,862
Non-cash cost of stock option plans 4,659 6,385 9,123 6,517
Impairment losses/(reversals) on investments 858,000 858,000 7,000 7,000
Fair value adjustment to equity swaps on Fiat shares (116,992) (116,992) 270,880 270,880
Losses/(gains) on disposals - (879,884) (879,483)
Change in provisions for employee benefits and other provisions 1,141 6,260 11,334 5,332
Change in deferred taxes (5,858) 1,601
Change in working capital 274,280 (34,356) 184,605 58,253
TOTAL 1,356,900 805,667
C) CASH FROM/(USED IN) INVESTING ACTIVITIES:
Investments relating to:
Recapitalisation of subsidiaries (406,467) (406,467) (350,000) (350,000)
Reduction of investments relating to:
Capital reductions and distribution of reserves by subsidiaries - -
Proceeds from disposals - 611
Other (investments)/disposals, net (6,429) 878,773 879,903
TOTAL (412,896) 529,384
D) CASH FROM/(USED IN) FINANCING ACTIVITIES:
Change in current financial assets (606,947) (606,947) 1,077,528 1,077,528
Change in non-current financial liabilities 6,251 6,251 (998,857) (998,857)
Change in current financial liabilities (318,556) (64,790) (666,539) (759,688)
Increase in share capital - -
Purchases of own shares - (238,531)
Sales of own shares - 738
Dividends paid (24,773) (509,419) (145,679)
TOTAL (944,025) (1,335,080)
E) TOTAL CHANGE IN CASH AND CASH EQUIVALENTS (21) (29)
F) CASH AND CASH EQUIVALENTS AT END OF THE YEAR 474 495