Chrysler 2009 Annual Report Download - page 60
Download and view the complete annual report
Please find page 60 of the 2009 Chrysler annual report below. You can navigate through the pages in the report by either clicking on the pages listed below, or by using the keyword search tool below to find specific information within the annual report.-
 1
1 -
2
-
3
-
4
-
5
-
6
-
7
-
8
-
9
-
10
-
11
-
12
-
13
-
14
-
15
-
16
-
17
-
18
-
19
-
20
-
21
-
22
-
23
-
24
-
25
-
26
-
27
-
28
-
29
-
30
-
31
-
32
-
33
-
34
-
35
-
36
-
37
-
38
-
39
-
40
-
41
-
42
-
43
-
44
-
45
-
46
-
47
-
48
-
49
-
 50
50 -
 51
51 -
 52
52 -
 53
53 -
 54
54 -
 55
55 -
 56
56 -
 57
57 -
 58
58 -
 59
59 -
 60
60 -
 61
61 -
 62
62 -
 63
63 -
 64
64 -
 65
65 -
 66
66 -
 67
67 -
 68
68 -
 69
69 -
 70
70 -
71
-
72
-
73
-
74
-
75
-
76
-
77
-
78
-
79
-
80
-
81
-
82
-
83
-
84
-
85
-
86
-
87
-
88
-
89
-
90
-
91
-
92
-
93
-
94
-
95
-
96
-
97
-
98
-
99
-
100
-
101
-
102
-
103
-
104
-
105
-
106
-
107
-
108
-
109
-
110
-
111
-
112
-
113
-
114
-
115
-
116
-
117
-
118
-
119
-
120
-
121
-
122
-
123
-
124
-
125
-
126
-
127
-
128
-
129
-
130
-
131
-
132
-
133
-
134
-
135
-
136
-
137
-
138
-
139
-
140
-
141
-
142
-
143
-
144
-
145
-
146
-
147
-
148
-
149
-
150
-
151
-
152
-
153
-
154
-
155
-
156
-
157
-
158
-
159
-
160
-
161
-
162
-
163
-
164
-
165
-
166
-
167
-
168
-
169
-
170
-
171
-
172
-
173
-
174
-
175
-
176
-
177
-
178
-
179
-
180
-
181
-
182
-
183
-
184
-
185
-
186
-
187
-
188
-
189
-
190
-
191
-
192
-
193
-
194
-
195
-
196
-
197
-
198
-
199
-
200
-
201
-
202
-
203
-
204
-
205
-
206
-
207
-
208
-
209
-
210
-
211
-
212
-
213
-
214
-
215
-
216
-
217
-
218
-
219
-
220
-
221
-
222
-
223
-
224
-
225
-
226
-
227
-
228
-
229
-
230
-
231
-
232
-
233
-
234
-
235
-
236
-
237
-
238
-
239
-
240
-
241
-
242
-
243
-
244
-
245
-
246
-
247
-
248
-
249
-
250
-
251
-
252
-
253
-
254
-
255
-
256
-
257
-
258
-
259
-
260
-
261
-
262
-
263
-
264
-
265
-
266
-
267
-
268
-
269
-
270
-
271
-
272
-
273
-
274
-
275
-
276
-
277
-
278
-
279
-
280
-
281
-
282
-
283
-
284
-
285
-
286
-
287
-
288
-
289
-
290
-
291
-
292
-
293
-
294
-
295
-
296
-
297
-
298
-
299
-
300
-
301
-
302
-
303
-
304
-
305
-
306
-
307
-
308
-
309
-
310
-
311
-
312
-
313
-
314
-
315
-
316
-
317
-
318
-
319
-
320
-
321
-
322
-
323
-
324
-
325
-
326
-
327
-
328
-
329
-
330
-
331
-
332
-
333
-
334
-
335
-
336
-
337
-
338
-
339
-
340
-
341
-
342
-
343
-
344
-
345
-
346
-
347
-
348
-
349
-
350
-
351
-
352
-
353
-
354
-
355
-
356
-
357
-
358
-
359
-
360
-
361
-
362
-
363
-
364
-
365
-
366
-
367
-
368
-
369
-
370
-
371
-
372
-
373
-
374
 |
 |

59
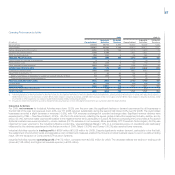
Components & Production Systems
Components & Production Systems had revenues of €10,327 million, a decrease of 25.1% primarily reflecting the drop in volumes attributable to the
market crisis, which was in part contained by a recovery for passenger cars in many markets during the second half of the year. Revenues for Magneti
Marelli were down 16.9% and sales for FPT Powertrain Technologies (-29.3%) were impacted by the significant decline in volumes experienced by the
Industrial & Marine product line. Revenues for Teksid and Comau decreased 30.9% and 35.2%, respectively.
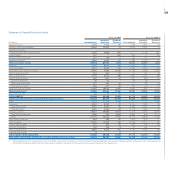
(€ million) 2009 2008 % change
FPT Powertrain Technologies 4,952 7,000 -29.3
Components (Magneti Marelli) 4,528 5,447 -16.9
Metallurgical Products (Teksid) 578 837 -30.9
Production Systems (Comau) 728 1,123 -35.2
Eliminations (459) (614) -
Total 10,327 13,793 -25.1
FPT Powertrain Technologies had 2009 revenues of €4,952 million, down 29.3% over 2008, with the decline in sales volumes being particularly
pronounced for the Industrial & Marine product line. Sales to external customers and joint ventures accounted for 16% of total revenues (22% for 2008).
The Passenger & Commercial Vehicles product line reported revenues of €3,372 million, a 7.6% decline over 2008, which was contained by a recovery for
passenger cars in many major markets during the second half of 2009. Sales to Fiat Group companies accounted for 92% of revenues, with the remainder
consisting principally of the sale of diesel engines to external customers. A total of 2,290,000 engines (-2.7%) and 2,208,000 transmissions (+9.4%) were
sold during the year.
Industrial & Marine reported revenues of €1,580 million, down 53% over 2008 due to the sharp volume declines experienced. A total of 268,000 engines
(-50.9%) were sold, primarily to Iveco (38%), CNH (25%) and Sevel (26%), the JV in light commercial vehicles. In addition, 53,000 transmissions (-50.2%)
and 105,000 axles (-61.5%) were delivered.
Magneti Marelli reported 2009 revenues of €4,528 million, a 16.9% reduction over 2008 (-14% on a comparable scope of operations) primarily
attributable to the drop in volumes experienced in the first half. The level of decline began to slow from July onward as demand from automakers
increased. The most significant decreases in sales volumes were experienced in Europe (excluding Poland) and the US, while performance was positive
in China and stable in Brazil.
All business lines were impacted by the economic downturn. The overall drop in volumes was most severe in the medium-high car segment (in which the
Lighting business line is the most active) and in light commercial vehicles (with negative consequences for the Suspension Systems business line). By
contrast, the Engine Control business line grew in India, driven by the production of diesel control units, and China. There was strong sales performance
for the Exhaust Systems business line in Brazil (to both external customers and Fiat).
Teksid had revenues of €578 million for 2009, down 30.9% over the prior year, principally due to lower sales volumes, which decreased 26.6% for the
Cast Iron business unit and 5.5% for the Aluminium business unit.
Comau had revenues of €728 million for 2009. The 35.2% decrease over 2008 (-31% on a constant scope of operations) was primarily attributable to
the Body Welding activities.
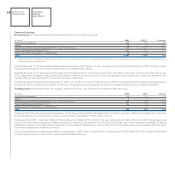
Other Businesses
Other Businesses includes the contribution from the Group’s publishing businesses, service companies and holding companies. For 2009, Other
Businesses had revenues of €1,096 million, down 21.4% year-over-year.
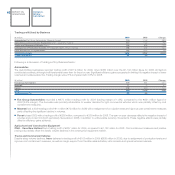
Trading profit/(loss)
The Group’s full year trading profit was €1,058 million, compared with €3,362 million for 2008. Decisive cost containment measures helped mitigate the
impact of revenue declines and contributed to the achievement of a 2.1% trading margin.