Chrysler 2009 Annual Report Download - page 123
Download and view the complete annual report
Please find page 123 of the 2009 Chrysler annual report below. You can navigate through the pages in the report by either clicking on the pages listed below, or by using the keyword search tool below to find specific information within the annual report.-
 1
1 -
2
-
3
-
4
-
5
-
6
-
7
-
8
-
9
-
10
-
11
-
12
-
13
-
14
-
15
-
16
-
17
-
18
-
19
-
20
-
21
-
22
-
23
-
24
-
25
-
26
-
27
-
28
-
29
-
30
-
31
-
32
-
33
-
34
-
35
-
36
-
37
-
38
-
39
-
40
-
41
-
42
-
43
-
44
-
45
-
46
-
47
-
48
-
49
-
50
-
51
-
52
-
53
-
54
-
55
-
56
-
57
-
58
-
59
-
60
-
61
-
62
-
63
-
64
-
65
-
66
-
67
-
68
-
69
-
70
-
71
-
72
-
73
-
74
-
75
-
76
-
77
-
78
-
79
-
80
-
81
-
82
-
83
-
84
-
85
-
86
-
87
-
88
-
89
-
90
-
91
-
92
-
93
-
94
-
95
-
96
-
97
-
98
-
99
-
100
-
101
-
102
-
103
-
104
-
105
-
106
-
107
-
108
-
109
-
110
-
111
-
112
-
 113
113 -
 114
114 -
 115
115 -
 116
116 -
 117
117 -
 118
118 -
 119
119 -
 120
120 -
 121
121 -
 122
122 -
 123
123 -
 124
124 -
 125
125 -
 126
126 -
 127
127 -
 128
128 -
 129
129 -
 130
130 -
 131
131 -
 132
132 -
 133
133 -
134
-
135
-
136
-
137
-
138
-
139
-
140
-
141
-
142
-
143
-
144
-
145
-
146
-
147
-
148
-
149
-
150
-
151
-
152
-
153
-
154
-
155
-
156
-
157
-
158
-
159
-
160
-
161
-
162
-
163
-
164
-
165
-
166
-
167
-
168
-
169
-
170
-
171
-
172
-
173
-
174
-
175
-
176
-
177
-
178
-
179
-
180
-
181
-
182
-
183
-
184
-
185
-
186
-
187
-
188
-
189
-
190
-
191
-
192
-
193
-
194
-
195
-
196
-
197
-
198
-
199
-
200
-
201
-
202
-
203
-
204
-
205
-
206
-
207
-
208
-
209
-
210
-
211
-
212
-
213
-
214
-
215
-
216
-
217
-
218
-
219
-
220
-
221
-
222
-
223
-
224
-
225
-
226
-
227
-
228
-
229
-
230
-
231
-
232
-
233
-
234
-
235
-
236
-
237
-
238
-
239
-
240
-
241
-
242
-
243
-
244
-
245
-
246
-
247
-
248
-
249
-
250
-
251
-
252
-
253
-
254
-
255
-
256
-
257
-
258
-
259
-
260
-
261
-
262
-
263
-
264
-
265
-
266
-
267
-
268
-
269
-
270
-
271
-
272
-
273
-
274
-
275
-
276
-
277
-
278
-
279
-
280
-
281
-
282
-
283
-
284
-
285
-
286
-
287
-
288
-
289
-
290
-
291
-
292
-
293
-
294
-
295
-
296
-
297
-
298
-
299
-
300
-
301
-
302
-
303
-
304
-
305
-
306
-
307
-
308
-
309
-
310
-
311
-
312
-
313
-
314
-
315
-
316
-
317
-
318
-
319
-
320
-
321
-
322
-
323
-
324
-
325
-
326
-
327
-
328
-
329
-
330
-
331
-
332
-
333
-
334
-
335
-
336
-
337
-
338
-
339
-
340
-
341
-
342
-
343
-
344
-
345
-
346
-
347
-
348
-
349
-
350
-
351
-
352
-
353
-
354
-
355
-
356
-
357
-
358
-
359
-
360
-
361
-
362
-
363
-
364
-
365
-
366
-
367
-
368
-
369
-
370
-
371
-
372
-
373
-
374
 |
 |

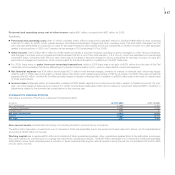
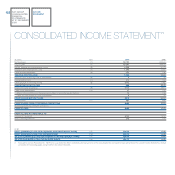
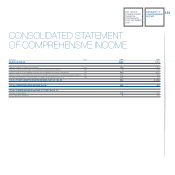
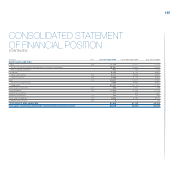
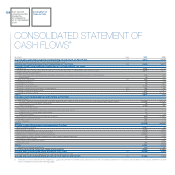
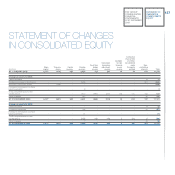
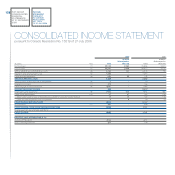
122 FIAT GROUP
CONSOLIDATED
FINANCIAL
STATEMENTS
AT 31 DECEMBER
2009
INCOME
STATEMENT
(€ million) Note 2009 2008
Net revenues (1) 50,102 59,564
Cost of sales (2) 43,261 49,612
Selling, general and administrative costs (3) 4,296 5,075
Research and development costs (4) 1,398 1,497
Other income (expenses) (5) (89) (18)
TRADING PROFIT/(LOSS) 1,058 3,362
Gains (losses) on the disposal of investments (6) 4 20
Restructuring costs (7) 312 165
Other unusual income (expenses) (8) (391) (245)
OPERATING PROFIT/(LOSS) 359 2,972
Financial income (expenses) (9) (753) (947)
Result from investments: (10) 27 162
Share of the profit/(loss) of investees accounted for using the equity method 18 133
Other income (expenses) from investments 9 29
PROFIT/(LOSS) BEFORE TAXES (367) 2,187
Income taxes (11) 481 466
PROFIT/(LOSS) FROM CONTINUING OPERATIONS (848) 1,721
Profit/(loss) from discontinued operations - -
PROFIT/(LOSS) (848) 1,721
PROFIT/(LOSS) ATTRIBUTABLE TO:
Owners of the parent (838) 1,612
Non-controlling interests (10) 109
(in €)
BASIC EARNINGS/(LOSS) PER ORDINARY AND PREFERENCE SHARE (13) (0.677) 1.290
BASIC EARNINGS/(LOSS) PER SAVINGS SHARE (13) (0.677) 1.445
DILUTED EARNINGS/(LOSS) PER ORDINARY AND PREFERENCE SHARE (13) (0.677) 1.285
DILUTED EARNINGS/(LOSS) PER SAVINGS SHARE (13) (0.677) 1.440
(*) Pursuant to Consob Resolution No. 15519 of 27 July 2006, the effects of related party transactions on the consolidated income statement are presented in the specific Income Statement schedule
provided in the following pages and are further described in Note 35.
CONSOLIDATED INCOME STATEMENT(*)