Chrysler 2009 Annual Report Download - page 62
Download and view the complete annual report
Please find page 62 of the 2009 Chrysler annual report below. You can navigate through the pages in the report by either clicking on the pages listed below, or by using the keyword search tool below to find specific information within the annual report.-
 1
1 -
2
-
3
-
4
-
5
-
6
-
7
-
8
-
9
-
10
-
11
-
12
-
13
-
14
-
15
-
16
-
17
-
18
-
19
-
20
-
21
-
22
-
23
-
24
-
25
-
26
-
27
-
28
-
29
-
30
-
31
-
32
-
33
-
34
-
35
-
36
-
37
-
38
-
39
-
40
-
41
-
42
-
43
-
44
-
45
-
46
-
47
-
48
-
49
-
50
-
51
-
 52
52 -
 53
53 -
 54
54 -
 55
55 -
 56
56 -
 57
57 -
 58
58 -
 59
59 -
 60
60 -
 61
61 -
 62
62 -
 63
63 -
 64
64 -
 65
65 -
 66
66 -
 67
67 -
 68
68 -
 69
69 -
 70
70 -
 71
71 -
 72
72 -
73
-
74
-
75
-
76
-
77
-
78
-
79
-
80
-
81
-
82
-
83
-
84
-
85
-
86
-
87
-
88
-
89
-
90
-
91
-
92
-
93
-
94
-
95
-
96
-
97
-
98
-
99
-
100
-
101
-
102
-
103
-
104
-
105
-
106
-
107
-
108
-
109
-
110
-
111
-
112
-
113
-
114
-
115
-
116
-
117
-
118
-
119
-
120
-
121
-
122
-
123
-
124
-
125
-
126
-
127
-
128
-
129
-
130
-
131
-
132
-
133
-
134
-
135
-
136
-
137
-
138
-
139
-
140
-
141
-
142
-
143
-
144
-
145
-
146
-
147
-
148
-
149
-
150
-
151
-
152
-
153
-
154
-
155
-
156
-
157
-
158
-
159
-
160
-
161
-
162
-
163
-
164
-
165
-
166
-
167
-
168
-
169
-
170
-
171
-
172
-
173
-
174
-
175
-
176
-
177
-
178
-
179
-
180
-
181
-
182
-
183
-
184
-
185
-
186
-
187
-
188
-
189
-
190
-
191
-
192
-
193
-
194
-
195
-
196
-
197
-
198
-
199
-
200
-
201
-
202
-
203
-
204
-
205
-
206
-
207
-
208
-
209
-
210
-
211
-
212
-
213
-
214
-
215
-
216
-
217
-
218
-
219
-
220
-
221
-
222
-
223
-
224
-
225
-
226
-
227
-
228
-
229
-
230
-
231
-
232
-
233
-
234
-
235
-
236
-
237
-
238
-
239
-
240
-
241
-
242
-
243
-
244
-
245
-
246
-
247
-
248
-
249
-
250
-
251
-
252
-
253
-
254
-
255
-
256
-
257
-
258
-
259
-
260
-
261
-
262
-
263
-
264
-
265
-
266
-
267
-
268
-
269
-
270
-
271
-
272
-
273
-
274
-
275
-
276
-
277
-
278
-
279
-
280
-
281
-
282
-
283
-
284
-
285
-
286
-
287
-
288
-
289
-
290
-
291
-
292
-
293
-
294
-
295
-
296
-
297
-
298
-
299
-
300
-
301
-
302
-
303
-
304
-
305
-
306
-
307
-
308
-
309
-
310
-
311
-
312
-
313
-
314
-
315
-
316
-
317
-
318
-
319
-
320
-
321
-
322
-
323
-
324
-
325
-
326
-
327
-
328
-
329
-
330
-
331
-
332
-
333
-
334
-
335
-
336
-
337
-
338
-
339
-
340
-
341
-
342
-
343
-
344
-
345
-
346
-
347
-
348
-
349
-
350
-
351
-
352
-
353
-
354
-
355
-
356
-
357
-
358
-
359
-
360
-
361
-
362
-
363
-
364
-
365
-
366
-
367
-
368
-
369
-
370
-
371
-
372
-
373
-
374
 |
 |

61
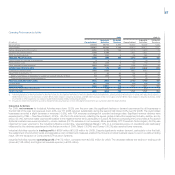
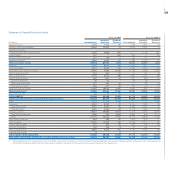
Components & Production Systems
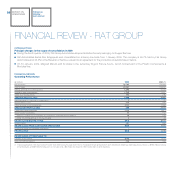
Components & Production Systems reported an aggregate trading loss of €40 million, compared with a €402 million trading profit for 2008. Although
significant cost containment measures were implemented, the sharp decline in demand resulted in negative performance for the year.
(€ million) 2009 2008 Change
FPT Powertrain Technologies (25) 166 -191
Components (Magneti Marelli) 25 174 -149
Metallurgical Products (Teksid) (12) 41 -53
Production Systems (Comau) (28) 21 -49
Total (40) 402 -442
Trading margin (%) (0.4) 2.9
FPT Powertrain Technologies closed 2009 with a trading loss of €25 million, compared with a profit of €166 million for 2008. The decrease was
principally the result of a contraction in volumes and, more importantly, a less favourable sales mix. Significant efficiency gains achieved in overhead,
manufacturing and purchasing costs only partially offset those negative impacts.
Magneti Marelli reported trading profit of €25 million for 2009 (€174 million for 2008). The positive effect of reductions in overheads and increased
production and purchasing efficiencies enabled the Sector to contain the impact of lower revenues.
Teksid closed the year with a trading loss of €12 million (profit of €41 million for 2008), reflecting the significant contraction in volumes.
Comau reported a trading loss of €28 million for 2009 (profit of €21 million for 2008). This decrease was primarily attributable to lower business volumes
for the Body Welding and Die-cutting operations.
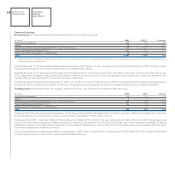
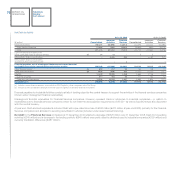
Other Businesses
In 2009, Other Businesses reported a trading loss of €63 million, including eliminations and consolidation adjustments, compared to a €102
million loss for 2008.
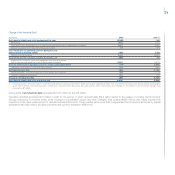
Operating profit/(loss)
Operating profit was €359 million for 2009, compared with €2,972 million for 2008. The decrease reflected lower trading profit (down €2,304 million)
and a €309 million increase in net unusual expense resulting from a €147 million increase in restructuring costs, a net increase in other unusual expense
of €146 million and a €16 million decrease in gains on disposal of investments.
Net gains on the disposal of investments totalled €4 million, compared to €20 million for 2008 which included gains of €14 million on the sale of the
interest in S.C.M. Ltda and €4 million on the sale of Targasys S.r.l.
Restructuring costs totalled €312 million and mainly related to CNH – Case New Holland (€87 million), Magneti Marelli (€62 million), FPT Powertrain
Technologies (€58 million), Fiat Group Automobiles (€54 million) and Iveco (€22 million). For 2008, restructuring costs totalled €165 million and mainly
related to Fiat Group Automobiles (€62 million) and Magneti Marelli (€77 million).
Other unusual income/(expense) was a negative €391 million and included write-downs by the Automobiles business of certain investments in
platforms and architectures related to the strategic realignment with Chrysler Group LLC, other non-recurring expenses and impairment losses recognized
by the Group as a consequence of the global economic crisis, in addition to costs related to the acquisition of the interest in Chrysler Group LLC. For 2008,
Other unusual income/(expense) was a negative €245 million and mainly included costs relating to the rationalisation of strategic suppliers and additional
provisions, associated with the serious and abrupt crisis in the automotive market globally, recognised by FGA and Iveco primarily for residual value risk on
leased vehicles, vehicles sold under buy-back commitments and used vehicles in inventory.