Chrysler 2009 Annual Report Download - page 224
Download and view the complete annual report
Please find page 224 of the 2009 Chrysler annual report below. You can navigate through the pages in the report by either clicking on the pages listed below, or by using the keyword search tool below to find specific information within the annual report.-
 1
1 -
2
-
3
-
4
-
5
-
6
-
7
-
8
-
9
-
10
-
11
-
12
-
13
-
14
-
15
-
16
-
17
-
18
-
19
-
20
-
21
-
22
-
23
-
24
-
25
-
26
-
27
-
28
-
29
-
30
-
31
-
32
-
33
-
34
-
35
-
36
-
37
-
38
-
39
-
40
-
41
-
42
-
43
-
44
-
45
-
46
-
47
-
48
-
49
-
50
-
51
-
52
-
53
-
54
-
55
-
56
-
57
-
58
-
59
-
60
-
61
-
62
-
63
-
64
-
65
-
66
-
67
-
68
-
69
-
70
-
71
-
72
-
73
-
74
-
75
-
76
-
77
-
78
-
79
-
80
-
81
-
82
-
83
-
84
-
85
-
86
-
87
-
88
-
89
-
90
-
91
-
92
-
93
-
94
-
95
-
96
-
97
-
98
-
99
-
100
-
101
-
102
-
103
-
104
-
105
-
106
-
107
-
108
-
109
-
110
-
111
-
112
-
113
-
114
-
115
-
116
-
117
-
118
-
119
-
120
-
121
-
122
-
123
-
124
-
125
-
126
-
127
-
128
-
129
-
130
-
131
-
132
-
133
-
134
-
135
-
136
-
137
-
138
-
139
-
140
-
141
-
142
-
143
-
144
-
145
-
146
-
147
-
148
-
149
-
150
-
151
-
152
-
153
-
154
-
155
-
156
-
157
-
158
-
159
-
160
-
161
-
162
-
163
-
164
-
165
-
166
-
167
-
168
-
169
-
170
-
171
-
172
-
173
-
174
-
175
-
176
-
177
-
178
-
179
-
180
-
181
-
182
-
183
-
184
-
185
-
186
-
187
-
188
-
189
-
190
-
191
-
192
-
193
-
194
-
195
-
196
-
197
-
198
-
199
-
200
-
201
-
202
-
203
-
204
-
205
-
206
-
207
-
208
-
209
-
210
-
211
-
212
-
213
-
 214
214 -
 215
215 -
 216
216 -
 217
217 -
 218
218 -
 219
219 -
 220
220 -
 221
221 -
 222
222 -
 223
223 -
 224
224 -
 225
225 -
 226
226 -
 227
227 -
 228
228 -
 229
229 -
 230
230 -
 231
231 -
 232
232 -
 233
233 -
 234
234 -
235
-
236
-
237
-
238
-
239
-
240
-
241
-
242
-
243
-
244
-
245
-
246
-
247
-
248
-
249
-
250
-
251
-
252
-
253
-
254
-
255
-
256
-
257
-
258
-
259
-
260
-
261
-
262
-
263
-
264
-
265
-
266
-
267
-
268
-
269
-
270
-
271
-
272
-
273
-
274
-
275
-
276
-
277
-
278
-
279
-
280
-
281
-
282
-
283
-
284
-
285
-
286
-
287
-
288
-
289
-
290
-
291
-
292
-
293
-
294
-
295
-
296
-
297
-
298
-
299
-
300
-
301
-
302
-
303
-
304
-
305
-
306
-
307
-
308
-
309
-
310
-
311
-
312
-
313
-
314
-
315
-
316
-
317
-
318
-
319
-
320
-
321
-
322
-
323
-
324
-
325
-
326
-
327
-
328
-
329
-
330
-
331
-
332
-
333
-
334
-
335
-
336
-
337
-
338
-
339
-
340
-
341
-
342
-
343
-
344
-
345
-
346
-
347
-
348
-
349
-
350
-
351
-
352
-
353
-
354
-
355
-
356
-
357
-
358
-
359
-
360
-
361
-
362
-
363
-
364
-
365
-
366
-
367
-
368
-
369
-
370
-
371
-
372
-
373
-
374
 |
 |

223
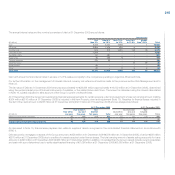
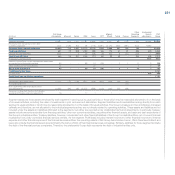
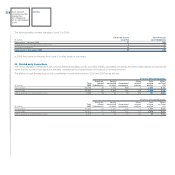
Information by geographical area32.
The Group’s parent company has its registered office in Italy. In 2009, revenues derived from external customers in Italy totalled € 12,744 million
(€14,319 million in 2008) and revenues derived from external customers in the Rest of the World totalled € 37,358 million (€45,245 million in 2008).
Following is a breakdown of revenues derived from external customers in the Rest of the World countries:
(€ million) 2009 2008
Brazil 8,825 8,691
United States 4,573 4,773
Germany 4,138 4,647
France 4,030 4,984
UK 1,807 2,360
Poland 1,567 1,390
Spain 1,342 2,263
Turkey 999 1,195
Other 10,077 14,942
Total revenues from external customers in RoW 37,358 45,245
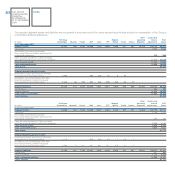
Total non-current Assets, excluding financial assets, deferred tax assets, defined benefit assets and rights arising under insurance contracts located in Italy
totalled €11,419 million at 31 December 2009 (€11,622 million at 31 December 2008) and the total of such assets located in the Rest of the World totalled
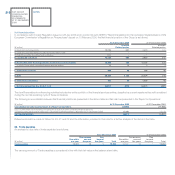
€11,163 million at 31 December 2009 (€10,430 million at 31 December 2008). Non-current assets located in the Rest of the World are broken down as
follows:
(€ million) At 31 December 2009 At 31 December 2008
United States 2,986 3,053
Brazil 2,307 1,525
Poland 1,288 1,130
France 918 980
Germany 669 784
Spain 581 674
Other 2,414 2,284
Total non current assets in RoW 11,163 10,430
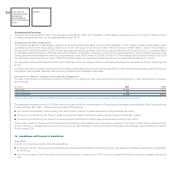
In 2009 and 2008, no single external customer of the Group accounted for 10 percent or more of consolidated revenues.
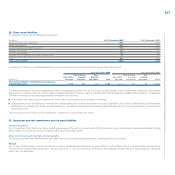
Information on financial risks33.
The Group is exposed to the following financial risks connected with its operations:
credit risk, regarding its normal business relations with customers and dealers, and its financing activities;
liquidity risk, with particular reference to the availability of funds and access to the credit market and to financial instruments in general;
market risk (principally relating to exchange rates, interest rates), since the Group operates at an international level in different currencies and uses financial
instruments which generate interest. The Group is also exposed to the risk of changes in the price of certain listed shares.
As described in the section Risk management, the Group constantly monitors the financial risks to which it is exposed, in order to detect those risks in
advance and take the necessary action to mitigate them.
The following section provides qualitative and quantitative disclosures on the effect that these risks may have upon the Group.