Chrysler 2009 Annual Report Download - page 207
Download and view the complete annual report
Please find page 207 of the 2009 Chrysler annual report below. You can navigate through the pages in the report by either clicking on the pages listed below, or by using the keyword search tool below to find specific information within the annual report.-
 1
1 -
2
-
3
-
4
-
5
-
6
-
7
-
8
-
9
-
10
-
11
-
12
-
13
-
14
-
15
-
16
-
17
-
18
-
19
-
20
-
21
-
22
-
23
-
24
-
25
-
26
-
27
-
28
-
29
-
30
-
31
-
32
-
33
-
34
-
35
-
36
-
37
-
38
-
39
-
40
-
41
-
42
-
43
-
44
-
45
-
46
-
47
-
48
-
49
-
50
-
51
-
52
-
53
-
54
-
55
-
56
-
57
-
58
-
59
-
60
-
61
-
62
-
63
-
64
-
65
-
66
-
67
-
68
-
69
-
70
-
71
-
72
-
73
-
74
-
75
-
76
-
77
-
78
-
79
-
80
-
81
-
82
-
83
-
84
-
85
-
86
-
87
-
88
-
89
-
90
-
91
-
92
-
93
-
94
-
95
-
96
-
97
-
98
-
99
-
100
-
101
-
102
-
103
-
104
-
105
-
106
-
107
-
108
-
109
-
110
-
111
-
112
-
113
-
114
-
115
-
116
-
117
-
118
-
119
-
120
-
121
-
122
-
123
-
124
-
125
-
126
-
127
-
128
-
129
-
130
-
131
-
132
-
133
-
134
-
135
-
136
-
137
-
138
-
139
-
140
-
141
-
142
-
143
-
144
-
145
-
146
-
147
-
148
-
149
-
150
-
151
-
152
-
153
-
154
-
155
-
156
-
157
-
158
-
159
-
160
-
161
-
162
-
163
-
164
-
165
-
166
-
167
-
168
-
169
-
170
-
171
-
172
-
173
-
174
-
175
-
176
-
177
-
178
-
179
-
180
-
181
-
182
-
183
-
184
-
185
-
186
-
187
-
188
-
189
-
190
-
191
-
192
-
193
-
194
-
195
-
196
-
 197
197 -
 198
198 -
 199
199 -
 200
200 -
 201
201 -
 202
202 -
 203
203 -
 204
204 -
 205
205 -
 206
206 -
 207
207 -
 208
208 -
 209
209 -
 210
210 -
 211
211 -
 212
212 -
 213
213 -
 214
214 -
 215
215 -
 216
216 -
 217
217 -
218
-
219
-
220
-
221
-
222
-
223
-
224
-
225
-
226
-
227
-
228
-
229
-
230
-
231
-
232
-
233
-
234
-
235
-
236
-
237
-
238
-
239
-
240
-
241
-
242
-
243
-
244
-
245
-
246
-
247
-
248
-
249
-
250
-
251
-
252
-
253
-
254
-
255
-
256
-
257
-
258
-
259
-
260
-
261
-
262
-
263
-
264
-
265
-
266
-
267
-
268
-
269
-
270
-
271
-
272
-
273
-
274
-
275
-
276
-
277
-
278
-
279
-
280
-
281
-
282
-
283
-
284
-
285
-
286
-
287
-
288
-
289
-
290
-
291
-
292
-
293
-
294
-
295
-
296
-
297
-
298
-
299
-
300
-
301
-
302
-
303
-
304
-
305
-
306
-
307
-
308
-
309
-
310
-
311
-
312
-
313
-
314
-
315
-
316
-
317
-
318
-
319
-
320
-
321
-
322
-
323
-
324
-
325
-
326
-
327
-
328
-
329
-
330
-
331
-
332
-
333
-
334
-
335
-
336
-
337
-
338
-
339
-
340
-
341
-
342
-
343
-
344
-
345
-
346
-
347
-
348
-
349
-
350
-
351
-
352
-
353
-
354
-
355
-
356
-
357
-
358
-
359
-
360
-
361
-
362
-
363
-
364
-
365
-
366
-
367
-
368
-
369
-
370
-
371
-
372
-
373
-
374
 |
 |

206 FIAT GROUP
CONSOLIDATED
FINANCIAL
STATEMENTS
AT 31 DECEMBER
2009
NOTES
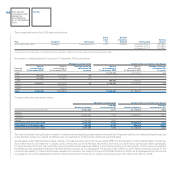
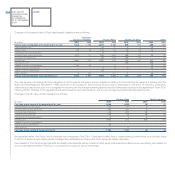
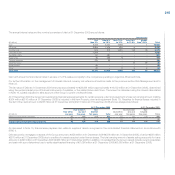
Changes in the present value of Post-employment obligations are as follows:
Employee
severance indemnity Pension Plans Health care plans Other
(€ million) 2009 2008 2009 2008 2009 2008 2009 2008
Present value of obligation at the beginning of the year 1,062 1,133 2,267 2,730 848 817 288 279
Current service cost - - 23 37 6 5 13 14
Interest costs 55 53 142 147 52 48 14 14
Contribution by plan participants - - 4 5 3 3 - -
Actuarial losses (gains) generated (17) (17) 255 (262) (36) (13) (2) (9)
Exchange rate differences - - 36 (218) (23) 40 - (3)
Benefits paid (102) (100) (161) (163) (51) (52) (31) (35)
Past service cost - - - - (10) - (19) 21
Change in scope of consolidation (2) 33 - 10 - - (1) (3)
(Gains) Losses on curtailments - - 4 (2) 4 - (2) (6)
(Gains) Losses on settlements - - (2) - - - - -
Other changes 5 (40) - (17) 1 - (2) 16
Present value of obligation at the end of the year 1,001 1,062 2,568 2,267 794 848 258 288
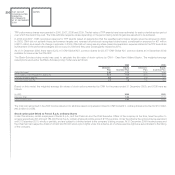
The past service cost arising as Other obligations in 2008 regards changes in French regulations relating to the Indemnité de depart à la retraite plan (the
National Interprofessional Agreement – ANI) which led to an increase in the minimum amount due to employees in the event of voluntary resignation,
determining a past service cost to be recognised in income over the average remaining service period of employees included in the agreement. From 2009,
following further changes in the regulations and as the result of new interpretations, the Group no longer recognised this past service cost.
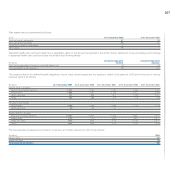
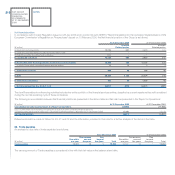
Changes in the fair value of plan assets are as follows:
Pension Plans Health care plans
(€ million) 2009 2008 2009 2008
Fair value of plan assets at the beginning of the year 1,554 2,036 39 47
Expected return on plan assets 113 151 3 6
Actuarial gains (losses) generated 122 (425) 6 (17)
Exchange rate differences 40 (208) (2) 3
Contribution by employer 113 139 48 49
Contribution by plan participants 4 5 3 3
Benefits paid (148) (150) (51) (52)
Change in scope of consolidation - 7 - -
(Gains) losses on settlements (2) - - -
Other changes - (1) - -
Fair value of plan assets at the end of the year 1,796 1,554 46 39
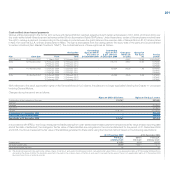
As discussed earlier, the Group, and in particular the companies of the CNH – Case New Holland Sector, began making contributions on a voluntary basis
in 2007 to a separate and independently managed fund established to finance the North American health care plans.
Plan assets for Post-employment benefits and Health-care benefits mainly consist of listed equity instruments and fixed income securities; plan assets do
not include treasury shares of Fiat S.p.A. or properties occupied by Group companies.