Chrysler 2009 Annual Report Download - page 31
Download and view the complete annual report
Please find page 31 of the 2009 Chrysler annual report below. You can navigate through the pages in the report by either clicking on the pages listed below, or by using the keyword search tool below to find specific information within the annual report.-
 1
1 -
2
-
3
-
4
-
5
-
6
-
7
-
8
-
9
-
10
-
11
-
12
-
13
-
14
-
15
-
16
-
17
-
18
-
19
-
20
-
 21
21 -
 22
22 -
 23
23 -
 24
24 -
 25
25 -
 26
26 -
 27
27 -
 28
28 -
 29
29 -
 30
30 -
 31
31 -
 32
32 -
 33
33 -
 34
34 -
 35
35 -
 36
36 -
 37
37 -
 38
38 -
 39
39 -
 40
40 -
 41
41 -
42
-
43
-
44
-
45
-
46
-
47
-
48
-
49
-
50
-
51
-
52
-
53
-
54
-
55
-
56
-
57
-
58
-
59
-
60
-
61
-
62
-
63
-
64
-
65
-
66
-
67
-
68
-
69
-
70
-
71
-
72
-
73
-
74
-
75
-
76
-
77
-
78
-
79
-
80
-
81
-
82
-
83
-
84
-
85
-
86
-
87
-
88
-
89
-
90
-
91
-
92
-
93
-
94
-
95
-
96
-
97
-
98
-
99
-
100
-
101
-
102
-
103
-
104
-
105
-
106
-
107
-
108
-
109
-
110
-
111
-
112
-
113
-
114
-
115
-
116
-
117
-
118
-
119
-
120
-
121
-
122
-
123
-
124
-
125
-
126
-
127
-
128
-
129
-
130
-
131
-
132
-
133
-
134
-
135
-
136
-
137
-
138
-
139
-
140
-
141
-
142
-
143
-
144
-
145
-
146
-
147
-
148
-
149
-
150
-
151
-
152
-
153
-
154
-
155
-
156
-
157
-
158
-
159
-
160
-
161
-
162
-
163
-
164
-
165
-
166
-
167
-
168
-
169
-
170
-
171
-
172
-
173
-
174
-
175
-
176
-
177
-
178
-
179
-
180
-
181
-
182
-
183
-
184
-
185
-
186
-
187
-
188
-
189
-
190
-
191
-
192
-
193
-
194
-
195
-
196
-
197
-
198
-
199
-
200
-
201
-
202
-
203
-
204
-
205
-
206
-
207
-
208
-
209
-
210
-
211
-
212
-
213
-
214
-
215
-
216
-
217
-
218
-
219
-
220
-
221
-
222
-
223
-
224
-
225
-
226
-
227
-
228
-
229
-
230
-
231
-
232
-
233
-
234
-
235
-
236
-
237
-
238
-
239
-
240
-
241
-
242
-
243
-
244
-
245
-
246
-
247
-
248
-
249
-
250
-
251
-
252
-
253
-
254
-
255
-
256
-
257
-
258
-
259
-
260
-
261
-
262
-
263
-
264
-
265
-
266
-
267
-
268
-
269
-
270
-
271
-
272
-
273
-
274
-
275
-
276
-
277
-
278
-
279
-
280
-
281
-
282
-
283
-
284
-
285
-
286
-
287
-
288
-
289
-
290
-
291
-
292
-
293
-
294
-
295
-
296
-
297
-
298
-
299
-
300
-
301
-
302
-
303
-
304
-
305
-
306
-
307
-
308
-
309
-
310
-
311
-
312
-
313
-
314
-
315
-
316
-
317
-
318
-
319
-
320
-
321
-
322
-
323
-
324
-
325
-
326
-
327
-
328
-
329
-
330
-
331
-
332
-
333
-
334
-
335
-
336
-
337
-
338
-
339
-
340
-
341
-
342
-
343
-
344
-
345
-
346
-
347
-
348
-
349
-
350
-
351
-
352
-
353
-
354
-
355
-
356
-
357
-
358
-
359
-
360
-
361
-
362
-
363
-
364
-
365
-
366
-
367
-
368
-
369
-
370
-
371
-
372
-
373
-
374
 |
 |

REPORT ON
OPERATIONS
HIGHLIGHTS
30
(E million) 2009 2008 2007
Net revenues 50,102 59,564(*) 58,529
Trading profit/(loss) 1,058 3,362 3,233
Operating profit/(loss) 359 2,972 3,152
Profit/(loss) before taxes (367) 2,187 2,773
Profit/(loss) for the year (848) 1,721 2,054
Attributable to:
Owners of the parent (838) 1,612 1,953
Non-controlling interests (10) 109 101
Basic earnings/(loss) per ordinary and preference share (E) (1) (0.677) 1.290 1.537
Basic earnings/(loss) per savings share (E) (1) (0.677) 1.445 1.692
Diluted earnings/(loss) per ordinary and preference share (E) (1) (0.677) 1.285 1.526
Diluted earnings/(loss) per savings share (E) (1) (0.677) 1.440 1.681
Investments in tangible and intangible assets 3,386 4,979(*) 3,985
of which: capitalised R&D costs 1,046 1,216 932
R&D expenditure (2) 1,692 1,986 1,741
Total assets 67,235 61,772 60,136
Net (debt)/cash (15,898) (17,954) (10,423)
of which: Net industrial (debt)/cash (4,418) (5,949) 355
Total equity 11,115 11,101 11,279
Equity attributable to owners of the parent 10,301 10,354 10,606
No. of employees at year end 190,014 198,348 185,227
(*) Following adoption of the improvement to IAS 16 in 2009, as described in the Notes to the Consolidated Financial Statements, 2008 net revenues were increased by €184 million and investments
in tangible and intangible assets were reduced by €284 million.
(1) See Note 13 to the Consolidated Financial Statements for additional information on the calculation of basic and diluted earnings per share.
(2) Includes capitalised R&D and R&D charged directly to the income statement.
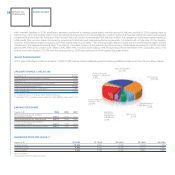
HIGHLIGHTS
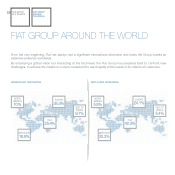
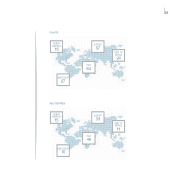
Revenues by
geographic market
Number of companies Employees Plants R&D Centres (E million)
2009 2008 2009 2008 2009 2008 2009 2008 2009 2008(*)
Italy 140 145 80,434 82,371 64 70 48 50 12,744 14,319
Europe (excluding Italy) 265 274 45,826 50,159 57 62 33 33 17,668 23,862
North America 74 70 11,157 12,305 16 19 15 15 5,021 5,711
Mercosur 33 33 42,397 43,042 27 27 10 10 9,798 9,975
Other regions 109 111 10,200 10,471 24 25 11 10 4,871 5,697
TOTAL 621 633 190,014 198,348 188 203 117 118 50,102 59,564
(*) Following adoption of the improvement to IAS 16 in 2009, net revenues for 2008 were increased by €184 million.
SELECT DATA BY REGION