Chrysler 2009 Annual Report Download - page 65
Download and view the complete annual report
Please find page 65 of the 2009 Chrysler annual report below. You can navigate through the pages in the report by either clicking on the pages listed below, or by using the keyword search tool below to find specific information within the annual report.-
 1
1 -
2
-
3
-
4
-
5
-
6
-
7
-
8
-
9
-
10
-
11
-
12
-
13
-
14
-
15
-
16
-
17
-
18
-
19
-
20
-
21
-
22
-
23
-
24
-
25
-
26
-
27
-
28
-
29
-
30
-
31
-
32
-
33
-
34
-
35
-
36
-
37
-
38
-
39
-
40
-
41
-
42
-
43
-
44
-
45
-
46
-
47
-
48
-
49
-
50
-
51
-
52
-
53
-
54
-
 55
55 -
 56
56 -
 57
57 -
 58
58 -
 59
59 -
 60
60 -
 61
61 -
 62
62 -
 63
63 -
 64
64 -
 65
65 -
 66
66 -
 67
67 -
 68
68 -
 69
69 -
 70
70 -
 71
71 -
 72
72 -
 73
73 -
 74
74 -
 75
75 -
76
-
77
-
78
-
79
-
80
-
81
-
82
-
83
-
84
-
85
-
86
-
87
-
88
-
89
-
90
-
91
-
92
-
93
-
94
-
95
-
96
-
97
-
98
-
99
-
100
-
101
-
102
-
103
-
104
-
105
-
106
-
107
-
108
-
109
-
110
-
111
-
112
-
113
-
114
-
115
-
116
-
117
-
118
-
119
-
120
-
121
-
122
-
123
-
124
-
125
-
126
-
127
-
128
-
129
-
130
-
131
-
132
-
133
-
134
-
135
-
136
-
137
-
138
-
139
-
140
-
141
-
142
-
143
-
144
-
145
-
146
-
147
-
148
-
149
-
150
-
151
-
152
-
153
-
154
-
155
-
156
-
157
-
158
-
159
-
160
-
161
-
162
-
163
-
164
-
165
-
166
-
167
-
168
-
169
-
170
-
171
-
172
-
173
-
174
-
175
-
176
-
177
-
178
-
179
-
180
-
181
-
182
-
183
-
184
-
185
-
186
-
187
-
188
-
189
-
190
-
191
-
192
-
193
-
194
-
195
-
196
-
197
-
198
-
199
-
200
-
201
-
202
-
203
-
204
-
205
-
206
-
207
-
208
-
209
-
210
-
211
-
212
-
213
-
214
-
215
-
216
-
217
-
218
-
219
-
220
-
221
-
222
-
223
-
224
-
225
-
226
-
227
-
228
-
229
-
230
-
231
-
232
-
233
-
234
-
235
-
236
-
237
-
238
-
239
-
240
-
241
-
242
-
243
-
244
-
245
-
246
-
247
-
248
-
249
-
250
-
251
-
252
-
253
-
254
-
255
-
256
-
257
-
258
-
259
-
260
-
261
-
262
-
263
-
264
-
265
-
266
-
267
-
268
-
269
-
270
-
271
-
272
-
273
-
274
-
275
-
276
-
277
-
278
-
279
-
280
-
281
-
282
-
283
-
284
-
285
-
286
-
287
-
288
-
289
-
290
-
291
-
292
-
293
-
294
-
295
-
296
-
297
-
298
-
299
-
300
-
301
-
302
-
303
-
304
-
305
-
306
-
307
-
308
-
309
-
310
-
311
-
312
-
313
-
314
-
315
-
316
-
317
-
318
-
319
-
320
-
321
-
322
-
323
-
324
-
325
-
326
-
327
-
328
-
329
-
330
-
331
-
332
-
333
-
334
-
335
-
336
-
337
-
338
-
339
-
340
-
341
-
342
-
343
-
344
-
345
-
346
-
347
-
348
-
349
-
350
-
351
-
352
-
353
-
354
-
355
-
356
-
357
-
358
-
359
-
360
-
361
-
362
-
363
-
364
-
365
-
366
-
367
-
368
-
369
-
370
-
371
-
372
-
373
-
374
 |
 |

REPORT ON
OPERATIONS
FINANCIAL
REVIEW -
FIAT GROUP
64
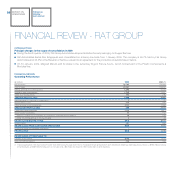
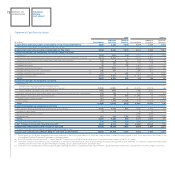
Consolidated Statement of Financial Position at 31 December 2009
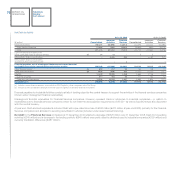
At 31 December 2009, total assets amounted to €67,235 million, increasing €5,463 million from the €61,772 million figure at 31 December 2008.
Non-current assets totalled €25,484 million, an increase of €733 million over the figure for 31 December 2008.
The increase in property, plant and equipment (+€430 million), intangible assets (+€151 million) and deferred tax assets (+€194 million), was partially offset
by the decrease in leased assets (-€48 million).
Current assets totalled €41,669 million, an increase of €4,685 million principally attributable to the increase in cash and cash equivalents (+€8,543
million), net of decreases for other principal line items (inventory, trade receivables and receivables from financing activities).
Receivables from financing activities totalled €12,695 million at 31 December 2009, a decrease of €441 million over 31 December 2008. Net of currency
translation differences and impairment, the decrease was €882 million.
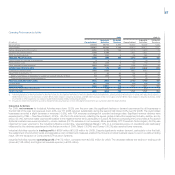
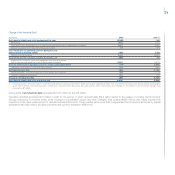
Working capital (net of items related to vehicles sold under buy-back commitments and vehicles no longer subject to lease agreements which are
included in inventory) was a negative €1,664 million, a €2,359 million decrease over the beginning of the period.
(€ million)
At 31.12.2009 At 31.12.2008 Change
Inventory (a) 7,887 10,453 -2,566
Trade receivables 3,649 4,390 -741
Trade payables (12,295) (13,258) 963
Net Current Taxes Receivable/(Payable) & Other Current Receivables/(Payables) (b) (905) (890) -15
Working capital (1,664) 695 -2,359
(a) Inventory is reported net of the value of vehicles sold under buy-back commitments by Fiat Group Automobiles and, following adoption of the improvement to IAS 16 in 2009, includes vehicles
of other Sectors which are no longer subject to buy-back commitments or lease agreements and are held for sale. The value of these ex-lease vehicles at 31 December 2008 (€48 million) was
deducted from inventory and, therefore, is reflected in the calculation of working capital.
(b) Other current payables included under the item Net Current Taxes Receivable/(Payable) & Other Current Receivables/(Payables) excludes the buy-back price payable to customers upon expiration
of lease contracts and advanced payments from customers for vehicles sold under buy-back commitments, which is equal to the difference, at the contract date, between the initial sale price and
the buy-back price. Recognition of such amounts is apportioned over the entire term of the contract.
At 31 December 2009, trade receivables, other receivables and receivables from financing activities falling due after that date and sold without recourse –
and, therefore, eliminated from the statement of financial position pursuant to the derecognition requirements of IAS 39 – totalled €4,611 million (€5,825
million at 31 December 2008). This amount includes financial receivables, mostly from the sales network, of €2,530 million (€3,181 million at 31 December
2008) sold to jointly-controlled financial services companies (FGA Capital group) and of €440 million (€752 million at 31 December 2008) sold to associate
financial services companies (Iveco Finance Holdings Limited).
Working capital (calculated on a comparable scope of operations and at constant exchange rates) decreased €2,562 million, principally due to the
significant reduction of inventories and a decrease in trade receivables, net of the decrease in trade payables resulting from lower production levels.