Chrysler 2009 Annual Report Download - page 66
Download and view the complete annual report
Please find page 66 of the 2009 Chrysler annual report below. You can navigate through the pages in the report by either clicking on the pages listed below, or by using the keyword search tool below to find specific information within the annual report.-
 1
1 -
2
-
3
-
4
-
5
-
6
-
7
-
8
-
9
-
10
-
11
-
12
-
13
-
14
-
15
-
16
-
17
-
18
-
19
-
20
-
21
-
22
-
23
-
24
-
25
-
26
-
27
-
28
-
29
-
30
-
31
-
32
-
33
-
34
-
35
-
36
-
37
-
38
-
39
-
40
-
41
-
42
-
43
-
44
-
45
-
46
-
47
-
48
-
49
-
50
-
51
-
52
-
53
-
54
-
55
-
 56
56 -
 57
57 -
 58
58 -
 59
59 -
 60
60 -
 61
61 -
 62
62 -
 63
63 -
 64
64 -
 65
65 -
 66
66 -
 67
67 -
 68
68 -
 69
69 -
 70
70 -
 71
71 -
 72
72 -
 73
73 -
 74
74 -
 75
75 -
 76
76 -
77
-
78
-
79
-
80
-
81
-
82
-
83
-
84
-
85
-
86
-
87
-
88
-
89
-
90
-
91
-
92
-
93
-
94
-
95
-
96
-
97
-
98
-
99
-
100
-
101
-
102
-
103
-
104
-
105
-
106
-
107
-
108
-
109
-
110
-
111
-
112
-
113
-
114
-
115
-
116
-
117
-
118
-
119
-
120
-
121
-
122
-
123
-
124
-
125
-
126
-
127
-
128
-
129
-
130
-
131
-
132
-
133
-
134
-
135
-
136
-
137
-
138
-
139
-
140
-
141
-
142
-
143
-
144
-
145
-
146
-
147
-
148
-
149
-
150
-
151
-
152
-
153
-
154
-
155
-
156
-
157
-
158
-
159
-
160
-
161
-
162
-
163
-
164
-
165
-
166
-
167
-
168
-
169
-
170
-
171
-
172
-
173
-
174
-
175
-
176
-
177
-
178
-
179
-
180
-
181
-
182
-
183
-
184
-
185
-
186
-
187
-
188
-
189
-
190
-
191
-
192
-
193
-
194
-
195
-
196
-
197
-
198
-
199
-
200
-
201
-
202
-
203
-
204
-
205
-
206
-
207
-
208
-
209
-
210
-
211
-
212
-
213
-
214
-
215
-
216
-
217
-
218
-
219
-
220
-
221
-
222
-
223
-
224
-
225
-
226
-
227
-
228
-
229
-
230
-
231
-
232
-
233
-
234
-
235
-
236
-
237
-
238
-
239
-
240
-
241
-
242
-
243
-
244
-
245
-
246
-
247
-
248
-
249
-
250
-
251
-
252
-
253
-
254
-
255
-
256
-
257
-
258
-
259
-
260
-
261
-
262
-
263
-
264
-
265
-
266
-
267
-
268
-
269
-
270
-
271
-
272
-
273
-
274
-
275
-
276
-
277
-
278
-
279
-
280
-
281
-
282
-
283
-
284
-
285
-
286
-
287
-
288
-
289
-
290
-
291
-
292
-
293
-
294
-
295
-
296
-
297
-
298
-
299
-
300
-
301
-
302
-
303
-
304
-
305
-
306
-
307
-
308
-
309
-
310
-
311
-
312
-
313
-
314
-
315
-
316
-
317
-
318
-
319
-
320
-
321
-
322
-
323
-
324
-
325
-
326
-
327
-
328
-
329
-
330
-
331
-
332
-
333
-
334
-
335
-
336
-
337
-
338
-
339
-
340
-
341
-
342
-
343
-
344
-
345
-
346
-
347
-
348
-
349
-
350
-
351
-
352
-
353
-
354
-
355
-
356
-
357
-
358
-
359
-
360
-
361
-
362
-
363
-
364
-
365
-
366
-
367
-
368
-
369
-
370
-
371
-
372
-
373
-
374
 |
 |

65
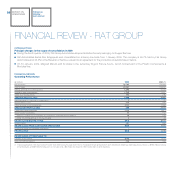
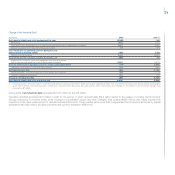
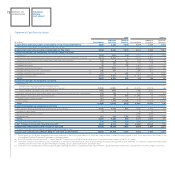
At 31 December 2009, consolidated net debt totalled €15,898 million, down €2,056 million over the €17,954 million figure at 31 December 2008.
Positive cash flow from operating activities and portfolio decreases for the financial services companies during 2009 more than offset capital expenditure
and currency translation differences.
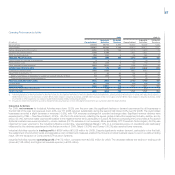
(€ million)
At 31.12.2009 At 31.12.2008
Financial payables (28,527) (21,379)
Asset-backed financing (7,086) (6,663)
Other (21,441) (14,716)
Current financial receivables from jointly-controlled financial services entities (a) 14 3
Financial payables, net of intersegment balances and current financial receivables
from jointly-controlled financial services entities (28,513) (21,376)
Other financial assets (b) 636 764
Other financial liabilities (b) (464) (1,202)
Liquidity 12,443 3,860
Current securities 217 177
Cash and cash equivalents 12,226 3,683
Net (debt)/cash (15,898) (17,954)
Industrial Activities (4,418) (5,949)
Financial Services (11,480) (12,005)
(a) Includes current financial receivables from FGA Capital.
(b) Includes assets and liabilities arising from the fair value recognition of derivative financial instruments.
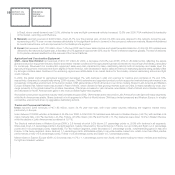
For 2009, financial payables increased €7,148 million (approximately €6.4 billion excluding currency translation differences). During the second half, the
Group issued bonds for approximately €4.9 billion. In particular:
Bonds were issued by the subsidiary Fiat Finance and Trade Ltd SA under the Global Medium Term Note programme for a total of €4.2 billion. The
principal issues were: a €1,250 million bond was issued in July, due in July 2012 (fixed coupon of 9%); a €1,250 million bond was issued in September,
due in September 2014 (fixed coupon of 7.625%); a €1,500 million bond was issued in November, due in February 2015 (fixed coupon of 6.875%).
In August, CNH, through its subsidiary Case New Holland Inc., completed a $1 billion senior note issue, due in September 2013 (7.75% coupon payable
semi-annually).
In addition to those issues, the Group raised new medium-term financing of €3.2 billion and repaid bonds totalling approximately €0.5 billion and other
financial payables totalling €1.4 billion.
At 31 December 2009, liquidity (cash, cash equivalents and current securities) totalled €12,443 million, an €8,583 million increase over the €3,860 million
figure at year-end 2008, which enables the Group to cover financial liabilities well beyond 2011 and ensures significant financial flexibility.
At year end, Cash and cash equivalents included Cash with a pre-determined use of €530 million (€473 million at year end 2008), primarily for the Financial
Services companies and allocated to servicing securitisation vehicles (included under asset-backed financing).